G2C::Proteomics
Human post-mortem synapse proteome integrity screening for proteomic studies of postsynaptic complexes
Àlex Bayés1,2, Mark O Collins3, Clare M Galtrey4, Clémence Simonnet5, Marcia Roy5, Mike DR Croning5, Gemma Gou1,2, Louie N van de Lagemaat5, David Milward6, Ian R Whittle5, Colin Smith7, Jyoti S Choudhary8 and Seth GN Grant5*
*Corresponding author: Seth.Grant@ed.ac.uk
- Molecular Physiology of the Synapse Laboratory, Biomedical Research Institute Sant Pau (IIB Sant Pau) Sant Antoni Ma Claret 167, 08025 Barcelona, Catalonia, Spain
- Universitat Autònoma de Barcelona, 08193 Bellaterra, Cerdanyola del Vallès, Spain
- Department of Biomedical Science, The Centre for Membrane Interactions and Dynamics, University of Sheffield, Western Bank, Sheffield S10 2TN, UK
- Department of Neurology, St George’s Hospital, London, UK
- Genes to Cognition Programme, Molecular Neuroscience, Centre for Clinical Brain Science and Centre for Neuroregeneration, University of Edinburgh, Edinburgh EH16 4SB, UK
- Linguamatics, 324 Cambridge Science Park, Cambridge CB4 0WG, UK
- Academic Department of Neuropathology, Centre for Clinical Brain Sciences, University of Edinburgh, Edinburgh, UK
- Proteomic Mass Spectrometry, The Wellcome Trust Sanger Institute, Hinxton, Cambridgeshire, UK
Overview
Synapses are fundamental components of brain circuits and are disrupted in over 100 neurological and psychiatric diseases. The synapse proteome is physically organized into multiprotein complexes and polygenic mutations converge on postsynaptic complexes in schizophrenia, autism and intellectual disability. Directly characterising human synapses and their multiprotein complexes from post-mortem tissue is essential to understanding disease mechanisms. However, multiprotein complexes have not been directly isolated from human synapses and the feasibility of their isolation from post-mortem tissue is unknown.
Here we establish a screening assay and criteria to identify post-mortem brain samples containing well-preserved synapse proteomes, revealing that neocortex samples are best preserved. We also develop a rapid method for the isolation of synapse proteomes from human brain, allowing large numbers of post-mortem samples to be processed in a short time frame. We perform the first purification and proteomic mass spectrometry analysis of MAGUK Associated Signaling Complexes (MASC) from neurosurgical and post-mortem tissue and find genetic evidence for their involvement in over seventy human brain diseases.
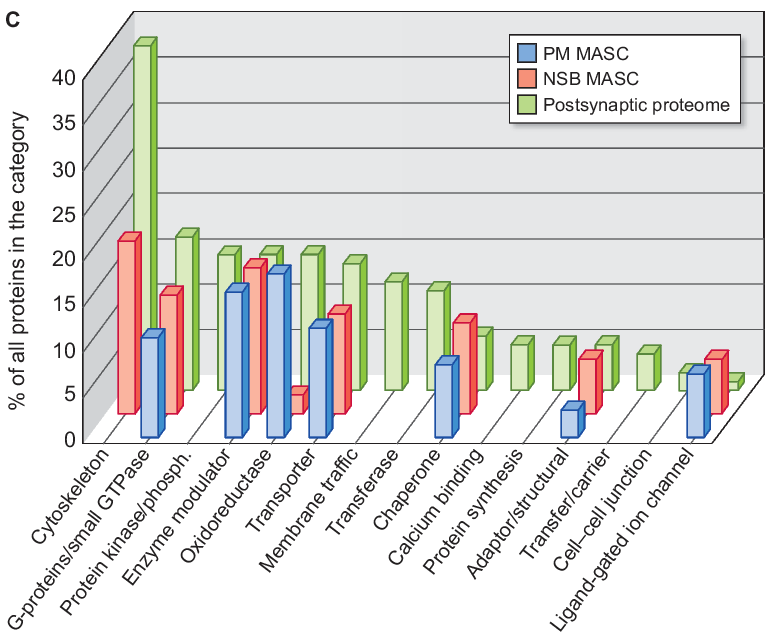
Enrichment of functional categories of proteins in MAGUK associated signaling complexes (MASC) detected in human brain samples from neurosurgical biopsy (NSB MASC, in red), post-mortem MASC (PM MASC, in blue) and the postsynaptic proteome (in green) significantly enriched as compared to the human genome.
We have demonstrated that synaptic proteome integrity can be rapidly assessed from human post-mortem brain samples prior to its analysis with sophisticated proteomic methods. We have also shown that proteomics of synapse multiprotein complexes from well preserved post-mortem tissue is possible, obtaining structures highly similar to those isolated from biopsy tissue. Finally we have shown that MASC from human synapses are involved with over seventy brain disorders. These findings should have wide application in understanding the synaptic basis of psychiatric and other mental disorders.
The full results and analyses of the study can be sorted, searched and downloaded
Figures
- Figure 1.
- Method for rapid isolation of synaptic-enriched fractions from PM human cortex. GluN2B degradation and correlation with number of intact PSD proteins.
- Figure 2.
- Comparative GluN2B degradation between brain areas.
- Figure 3.
- Affinity purification of the MAGUK Associated Signalling Complexes (MASC) from brain cortex and observed MASC composition in NSB or PM frontal cortex.
- Figure 4.
- Involvement of MASC proteins in genetic diseases.
Figure 1. Method for rapid isolation of synaptic-enriched fractions from PM human cortex. GluN2B degradation and correlation with number of intact PSD proteins.
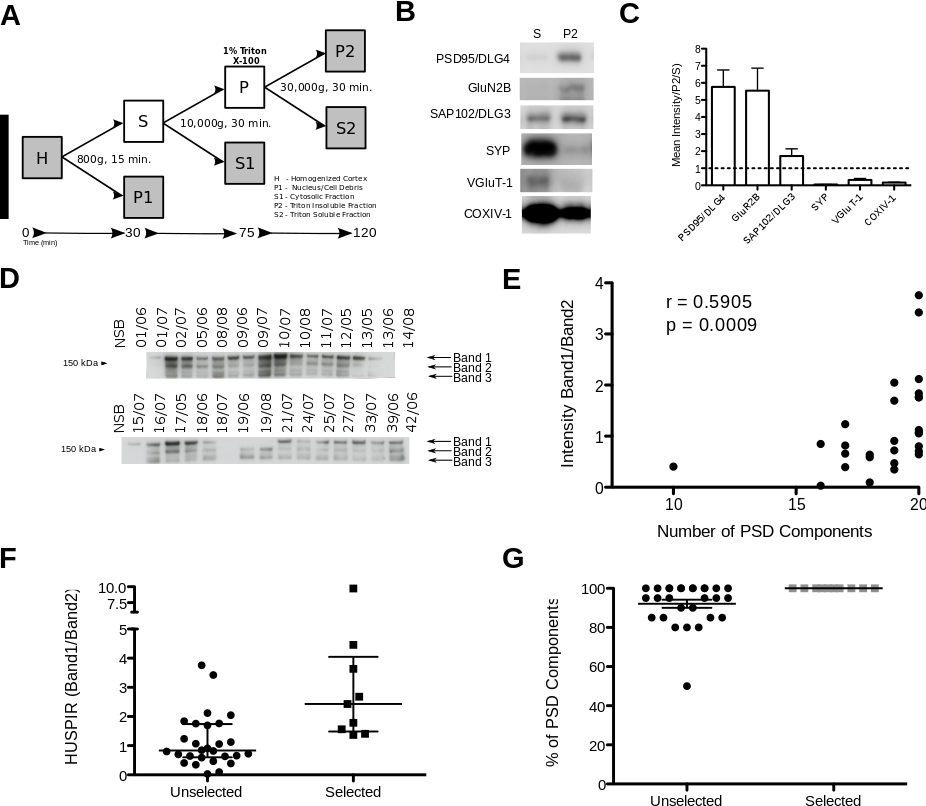
a. Schematic representation of the subcellular fractionation method used to obtain postsynaptic protein enriched fractions (P2). Procedure time is indicated. H and S, homogenized cortex; P1, nucleus/cell debris; S1, cytosolic fraction; P2, triton insoluble fraction; S2, triton soluble fraction.
b. Immunoblot showing protein enrichment or depletion between sample S and P2 from isolation protocol described in A. Postsynaptic markers: PSD95/DLG4, GluN2B and SAP102/DLG3. Pre-synaptic-markers: SYP and VGluT-1. A marker of mitochondria is also included: COXIV-1.
c. Mean fold enrichment of proteins in final P2 fraction compared to starting S fraction analyzed by immunoblotting (n =5). Postsynaptic proteins (PSD-95/DLG4, GluN2B and SAP102/DLG3) were enriched in P2, while presynaptic (SYP and VGluT-1) and mitochondrial markers (COX IV-1) were depleted (S/P2 < 1).
d.GluN2B immunoblot from control NSB and 28 PM samples (Additional file 1). PM samples shows three main bands, band 1 corresponding with the full-length protein. The ratio of band1 over band2 provides HUSPIR ratio. The antibody used was designed against the C-terminal region of GluN2B (BD Bioscience ref. 610416).
e. For each PM sample the HUSPIR ratio (intensity between GluN2B bands 1 and 2) is plotted against the number of intact PSD proteins. Significant positive Spearman’s coefficient of correlation (r) and p-value (p) are indicated.
f. HUSPIR ratio for the set of 28 unselected samples and the set of 9 samples selected. Median and interquartile range shown.
g. Comparison between percentage of PSD components observed in the set of 28 unselected samples and the prospective set of 9 selected samples. Median and interquartile range shown.
Figure 2. Comparative GluN2B degradation between brain areas.
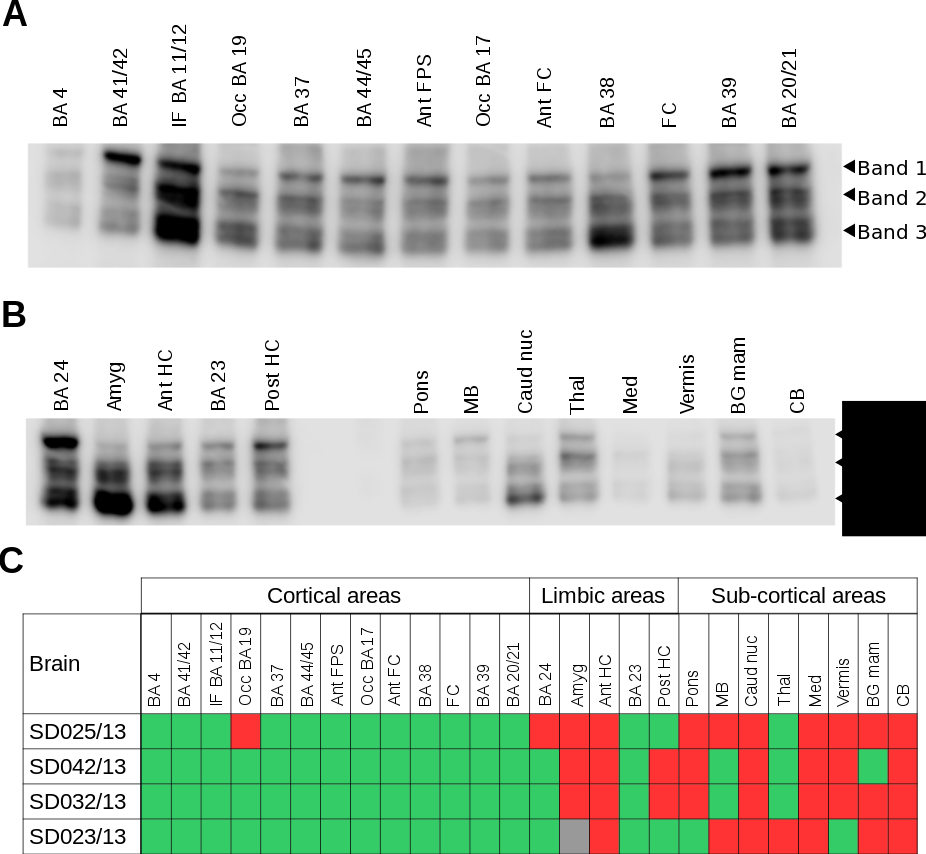
a. Representative immunoblot of GluN2B for 13 different cortical regions from brain SD025/13 (Additional file 1). These cortical regions included the Broadmann Areas (BA) 4, 11/12, 17, 19, 20/21, 37, 38, 39, 41/42 and 44/45 (Broca’s area), as well as three frontal cortex samples: frontal convexity (FC), anterior frontal convexity (Ant FC) and anterior frontal parasagital (Ant FPS). GluN2B degradation bands are indicated.
b. Representative immunoblot of GluN2B for 5 limbic areas: Broadmann areas (BA) 23 and 24, anterior and posterior Hipocampus (HC) and amygdala (Amyg); and 8 sub-cortical regions: Pons, Midbrain (MB), Caudate nucleus (Caud nuc), Thalamus (Thal), Medulla (Med), Vermis, Basal ganglia mammillary body (BG mam) and Cerebellum (CB). GluN2B degradation bands are indicated. C. Plot summarizing HUSPIR values for 26 brain areas (13 cortical, 5 limbic and 8 sub-cortical) analysed by immunoblot for GluN2B degradation in 4 different brains (SD025/13, SD042/13, SD032/13 and SD023/13). HUSPIR values above one are indicated in green and below in red. Grey indicates no measure could be taken.
Figure 3. Affinity purification of the MAGUK Associated Signalling Complexes (MASC) from brain cortex and observed MASC composition in NSB or PM frontal cortex.
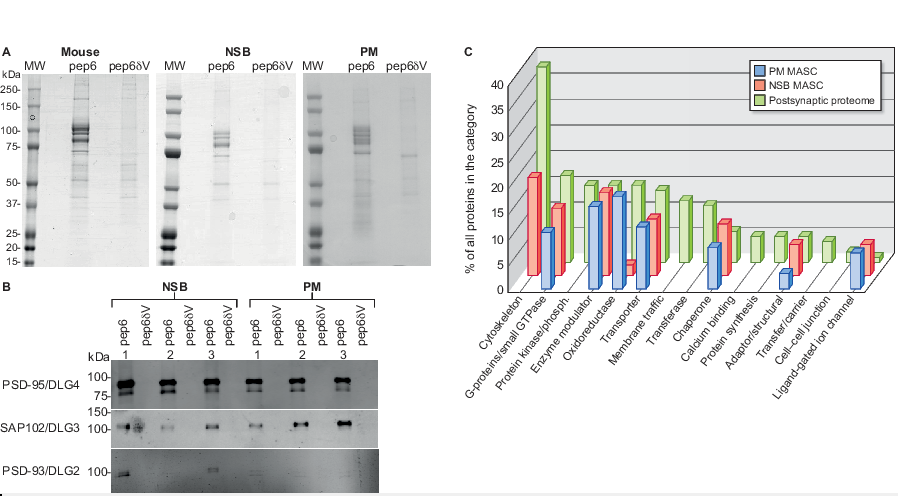
a. Coomassie stained SDS-PAGE electrophoresis of MASC complexes isolated by affinity purification from mouse cortex, human NSB and PM frontal cortex. Human sample details in Additional file 1. MW: Molecular Weight markers; pep6, eluate from affinity purification using pep6 peptide; pep6δV, eluate from affinity purification using control peptide.
b. Immunoblots of three members of the DLG4/PSD-95 family (DLG4/PSD-95, DLG3/SAP102 and DLG2/PSD-93) for 6 human MASC purifications (pep6), and corresponding controls (pep6δV); three from NSB and three from PM frontal cortex.
c. Panther Protein Classes in the postsynaptic proteome (in green), the NSB MASC (in red) or the PM MASC (in blue) that are significantly enriched as compared with the human genome. Bar height corresponds with percentage of all proteins found in that Protein Class. (See Additional file 2 for methods and detailed bioinformatics functional analysis).
Figure 4. Involvement of MASC proteins in genetic diseases.
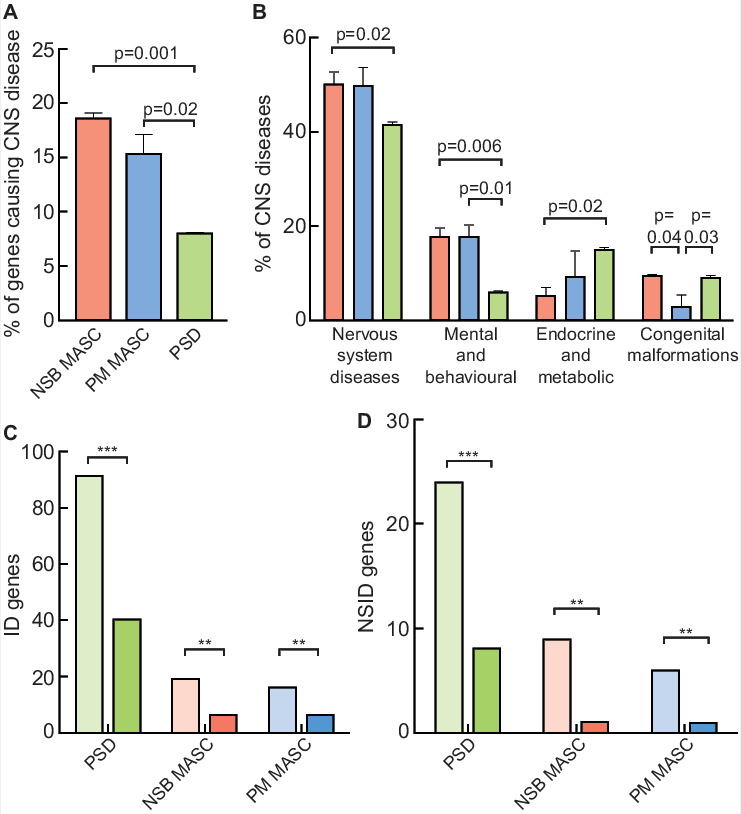
a. Percentage of genes expressed in human NSB MASC, PM MASC and PSD causing central nervous system diseases described in OMIM.
b. Proportion of CNS diseases caused by genes found in human NSB MASC (red), PM MASC (blue) and PSD (green). ICD-10 groups (Chapters) indicated on x-axis: Congenital Malformations refers to ICD-10 Chapter XVII, Nervous System Diseases refers to ICD-10 Chapter VI, Endocrine and metabolic refers to ICD-10 Chapter IV and Mental and Behavioural refer to ICD-10 Chapter V. Means compared by Student’s t-test.
c. Genes expressed at the postsynapse causing any form of genetic Intellectual Disability (ID). For each postsynaptic protein complex pale columns indicate number of genes causing ID and dark columns the expected number to be found by chance. Binomial statistics are used to compute significance of the difference between observed and expected (Binomial Statistics, ***, p <1E-05; **, p <1E-03; *, p <0,05)
d. Genes expressed at the postsynapse causing any form of genetic non-syndromic Intellectual Disability (NSID). For each postsynaptic protein complex pale columns indicate number of genes causing ID and dark columns the expected number to be found by chance. Binomial statistics are used to compute significance of the difference between observed and expected (Binomial Statistics, ***, p <1E-05; **, p <1E-03; *, p <0,05).
Tables
- Table 1.
- Significantly enriched protein classes of species-specific PSD proteins.
Table 1. Significantly enriched protein classes of species-specific PSD proteins.
| Parameter | Spearman r | p value (two-tailed) |
|---|---|---|
| PM Interval (n=28) | 0.01079 | 0.9566 (n.s.) |
| pH (n=25) | −0.075 | 0.1193 (n.s.) |
| RNA Integrity Number (RIN) (n=20) | 0.1193 | 0.6163 (n.s.) |
| Intensity Band 1/Band 2 (n=28) | 0.5905 | 0.0009 (***) |
| Intensity Band 1/Band 3 (n=28) | −0.01091 | 0.956 (n.s.) |
| Intensity Band 1/Band 2 + Band 3 (n=28) | 0.4831 | 0.0092 (**) |
Supplementary Tables
- Additional File 1.
- Human Samples. Description of human samples used in this study.
- Additional File 2.
- Additional information, figures and figure legends on immunoblot analysis of post-mortem brain and bioinformatics functional analysis of MASC complex.
- Additional File 3.
- Proteomic Data. List of proteins identified in the human MASC from neurosurgical and post-mortem tissue.
- Additional File 4.
- Bioinformatics Functional Analysis. Bioinformatics functional analysis of proteins identified in human MASC from neurosurgical and post-mortem tissue.
- Additional File 5.
- MASC genes in Disease. List of human MASC genes known to cause inherited diseases or positively associated with genetically complex psychiatric and neurologic disorders.
- Additional File 6.
- MASC genes causing Intellectual Disability. List of human MASC genes known to cause Intellectual Disability.
Additional File 1. Human Samples. Description of human samples used in this study.
Sheet #1. Post-mortem cortical samples used to isolate synaptic-enriched fractions and HUman Synapse Proteome Integrity Ratio (HUSPIR). For each sample the following information is given: Brain bank code, Brain Region, Gender, Age, PMI (hours), Brain pH, RIN, Cause of Death, Neuropath Diagnosis and HUSPIR.
Sheet #2. Information on NSB and PM samples used for proteomics. For NSB samples the following information is given: Brain Bank Sample Code, Sample Name for Proteomics, Age, Sex, Precise Neocortical Location, Reason of Surgery. For PM samples the following information is given: Brain Bank Sample Code, Sample Name for Proteomics, Age, Sex, Precise Neocortical Location, Cause of Death, PMI (hours), Brain pH, RIN, Neuropathological Diagnosis and HUSPIR.
Additional File 2. Additional information, figures and figure legends on immunoblot analysis of post-mortem brain and bioinformatics functional analysis of MASC complex.
Supplementary Methods
- Immunoblot and protein expression quantification.
- MASC Bioinformatics Functional Analysis.
- Analysis of MASC interaction network.
Supplementary Results
- Bioinformatic functional analysis of human MASC.
Supplementary Figures
- Figure S1. Immunoblots of human PM samples with postsynaptic density proteins.
- Figure S2. Immunoblots of the selected group of human PM samples with postsynaptic density proteins.
- Figure S3. Functional differences between hMASC isolated from NSB or PM tissue.
- Figure S4. MASC Interactome.
Supplementary References
Additional File 3. Proteomic Data. List of proteins identified in the human MASC from neurosurgical and post-mortem tissue.
Sheet #1. Proteomic information on all proteins identified.
Sheet #2. Proteomic data on validated proteins identified (highlighted in yellow) as NSB or PM MASC components.
Sheet #3. Thresholds used to validate a protein as identified.
Additional File 4. Bioinformatics Functional Analysis. Bioinformatics functional analysis of proteins identified in human MASC from neurosurgical and post-mortem tissue.
Sheet #1. Functional Classification of MASC proteins using Panther Classification System. Information retrieved from Panther: Protein Family/Subfamily, GO Molecular Function, GO Biological Process, GO Cellular Component, Panther Protein Class and Pathways.
Sheet #2. Statistical overrepresentation test of Panther Protein Classes in the postsynaptic proteome using the whole human genome as background.
Sheet #3. Statistical overrepresentation test of Panther Protein Classes in the NSB - Total MASC proteome using the whole human genome as background.
Sheet #4. Statistical overrepresentation test of Panther Protein Classes in the PM - Total MASC proteome using the whole human genome as background.
Sheet #5. Statistical overrepresentation test of Panther Protein Classes in MASC proteins found in triplicate in NSB using the postsynaptic proteome as background.
Additional File 5. MASC genes in Disease. List of human MASC genes known to cause inherited diseases or positively associated with genetically complex psychiatric and neurologic disorders.
Sheet #1. Summary table with numbers of diseases and genes causing PNS, CNS, CNS and PNS and non-NS, as defined by OMIM and text mining curation.
Sheet #2. List of genes coding for MASC proteins and causing inherited diseases as described in the Online Mendelian Inheritance in Man (OMIM) repository, or identified using text minig software as assocaited to disease. Identified diseases are classified into those affecting the Peripheral Nervous System (PNS), central nervous system (CNS) or both (PNS and CNS). Diseases are also classified using the International Classification of Diseases ICD-10.
Additional File 6. MASC genes causing Intellectual Disability. List of human MASC genes known to cause Intellectual Disability.
Sheet #1. List of all genes identified in GENECARDS as related to ‘Intellectual Disability’ or ‘Mental Retardation’. Pertainance to postsynaptic protein complex is given.
Sheet #2. List of genes known to cause non-syndromic intellectual disability as described in the scientific literature. Pertainance to postsynaptic protein complex is given.