G2C::Genetics
PSD-95-GK truncation mouse
S.G.N. Grant and the G2C Consortium
Corresponding email: Seth.Grant@ed.ac.uk
G2CMine Data Warehouse
| Dlg4 @ G2CMine |
Genetic and Genomic Information
| Gene symbol | Dlg4 |
| MGI ID | MGI:1277959 |
| G2Cdb mouse | G00000004 |
| Ensembl mouse | ENSMUSG00000020886 |
| G2Cdb human | G00000029 |
| Ensembl human | ENSG00000132535 |
G2CMine Data Warehouse
G2CMine integrates the scientific findings of the Genes to Cognition Programme that utilised neuroproteomics, psychiatric genetics, high-throughput mouse gene targeting combined with behavioural and electrophysiological phenotyping and informatics in order to develop a general strategy for understanding cognition at the molecular, cellular and systems neuroscience levels.
G2CMine provides comprehensive Gene Ontology, Mammalian Phenotype Ontology, Human Phenotype Ontology, UniProt, genetic and protein interactions, and regional mouse brain expression results, together with the phenotyping results of the G2C Programme.
Mutation
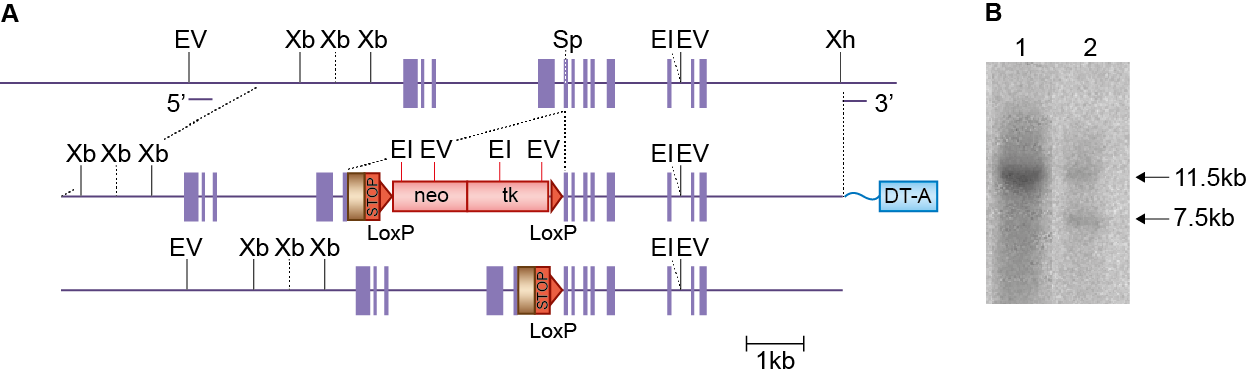
E14TG2a mouse embryonic stem (ES) cells were targeted with a vector containing 5.2kb and 5kb of flanking genomic DNA. This was inserted in frame into exon 13 of Dlg4 with neomycin/tk cassette. Correctly targeted ES cells were identified by long range PCR and southern blot. For southern blot, genomic DNA was cut with EcoRV, XbaI + HindIII or Xba alone for null mutants.
The correctly targeted ES cells were injected into C57BL/6 blastocysts to create chimeric mice, which were further bred with C57BL/6J mice to generate heterozygous (+/–) Dlg4 mutant mice. Those F1 heterozygous mice were further backcrossed with C57BL/6J mice to maintain the line.
Targeted mutation of the PSD-95 gene. a. PSD-95 genomic DNA with restriction enzyme sites (EI, EcoRI; EV, EcoRV; Sp, SpeI; Xb, XbaI; Xh, XhoI.); boxes, exons. With integrated targeting vector (middle) and targeted locus (bottom). tk, thymidine kinase gene; neo, neomycin resistance gene; HA, haemaglutinin epitope tag; STOP, stop codon; arrowheads, loxP sites; DT-A, Diptheria toxin A based vector. b. Genomic southern blot of XbaI digested ES cell DNA following Cre excision of selection cassette probed with 3' flanking probe. Lane 1, wild type (wt) DNA showing 11.5 kb band; lane 2, wt and 7.5 kb mutant band as predicted.
Genotyping
Genotyping of mice was carried out by PCR using the following primers: A PSD-95 DNA fragment of 2400bp was amplified using a forward primer 5'-CCGACTGCTCACTAGTATTTTCTCCC-3' with reverse primer 5'-CCGTAGAGGTGGCTGTTGTA-3'. Wild type and mutant alleles were distinguished by digesting with XbaI giving rise to a 1400bp mutant fragment.
Expression
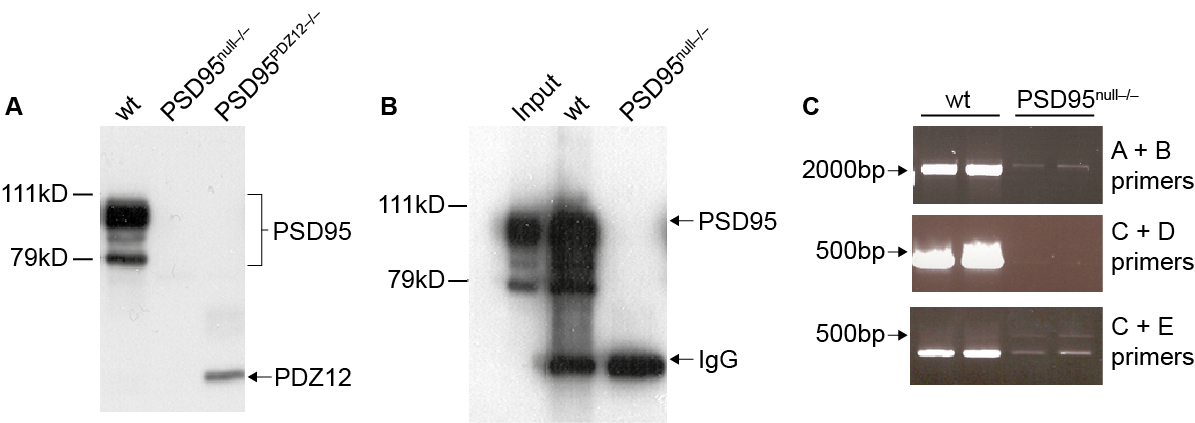
Expression of PSD-95 mutant proteins. Immunoblotting and immunoprecipitations: Mouse hippocampi were homogenised in 1x DOC buffer (1% Deoxycholate; 50mM Tris pH9.0; 50mM NaF; 20μM ZnCl2; 500mg PMSF; 1mM NaVO4) containing Complete EDTA-free protein inhibitors (Boehringer). After centrifugation at 25,000rpm for 15 minutes 4 °C, 1mg or 3mg aliquots of protein extract diluted in 1ml buffer were incubated overnight at 4 °C with an anti-PSD-95 N-terminal antibody (Upstate Biotech). Immunocomplexes were captured by incubating with 40μl of a 50% solution of protein G coupled sepharose (Amersham Pharmacia) for 2 hours at 4 °C. After washing in 1x lysis buffer, immunocomplexes were analysed by immunoblotting and probing with the indicated antibody. Protein extracts (20 μg per lane) were separated using 6-10% SDS-PAGE, and standard procedures were used for immunoblotting.
a. Immunoblot of PSD-95 protein in hippocampal extracts. Immunoblot of PSD-95 protein in hippocampal extracts of wild type mice, PSD-95 PDZ12 mutant (-/-) and PSD-95 null mutant (-/-). Multiple wild type PSD-95 proteins migrate in molecular range of 95-79 kDa (PSD-95, right side arrow). Arrow marked PDZ12 on right shows location of N-terminal fragment observed in PSD-95PDZ12 mutant mice. No PSD-95 proteins were detected in PSD-95 null mutant mice.
b. Immunoprecipitation of PSD-95 from hippocampal extracts. Lysates from wild type (1mg total protein) and PSD-95null mutant mouse hippocampi (3mg total protein) were subjected to immunoprecipitation with anti-PSD-95, separated by 8% SDS-PAGE, and immunoblotted with anti-PSD-95. No PSD-95 proteins were detected in PSD-95 null mutant mice.
c. RT-PCR analysis of PSD-95 RNA transcripts in wild type and PSD-95 null mutants (-/-). Total RNA was extracted from wild type and PSD-95 mutant hippocampi using Qiagen RNAeasy kits and the first strand synthesis of cDNA carried out using Invitrogen's Superscript II reverse transcriptase as instructed in manufacturer's protocol. 10% of cDNA reaction was subsequently used as template for a standard PCR amplification using the following 3 primer pairs: A) 5'-GGACTGTCTCTGTATAGTGACAACCAAG-3' and B) 5'-CGTAGAGGTGGCTGTTGTA-3'; C) 5'-ACCAAGGCGGATCGTGATCCA-3' and D) 5'-GCCTCGAATCGGCTATA-3' or E) 5'- GCTTGCCACCACTCTTCGTCGC - 3'. Bands were robustly observed for wild-type samples whereas low levels (<5%) of transcripts were detected in PSD-95 null hippocampus.
Breeding
Birth of Dlg4(GK)-/- mice followed approximately Mendelian ratios with 21% of offspring being homozygous knockouts. Genotypes of 3-week-old pups from Dlg4(GK)+/- intercrosses identified 31 wt, 79 Dlg4(GK)+/- and 29 Dlg4(GK)-/- progeny (Χ2 p= 0.265). Male and female Dlg4(GK)-/- mice developed normally to adulthood, exhibited normal body size and no gross abnormalities. Dlg4(GK) mice were maintained by backcrossing onto the C57BL/6J background; heterozygous males and females were fertile and used to set up intercrosses to generate homozygous and wildtype mice to study.
Overview
Mutant mice showed profound overall behavioural difference from wildtypes, with 11 of 16 behaviour variables significantly impacted by this mutation. In the elevated plus maze task, four behavioural variables of five were significantly impacted in mutants. In the open field/novel object exploration task, two behavioural variables of two were significantly impacted in mutants. In the rotarod task, three behavioural variables of three were significantly impacted in mutants. In the fear learning task, one behavioural variable, fear learning trial effect, was significantly increased in mutants. In the contextual memory task, one behavioural variable, contextual memory change, was significantly decreased in mutants. Only cued memory was unaffected. Definitions of variables may be found below.
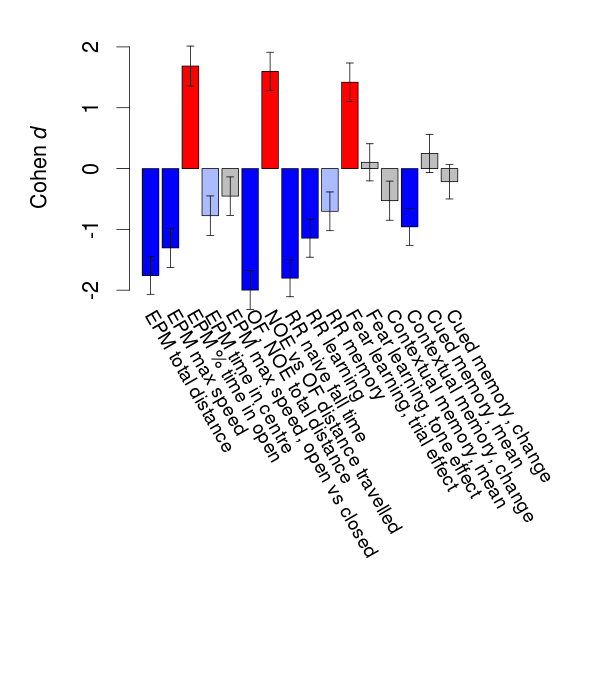
Variables shown are: EPM total distance, Total distance (cm) travelled in any arm or central zone of the EPM. EPM max speed, Maximum speed (cm/s) travelled in any arm or central zone of the EPM. EPM % time in open, Percentage of time in the open or closed arms of the EPM spent in open arms. EPM time in centre, Total time (s) spent in the central zone of the EPM. EPM max speed, open vs closed, Difference between the maximum speed (cm/s) observed in the open arms and the closed arms of the EPM. OF, NOE total distance, Total distance travelled (log₁₀ cm) during initial exposure to the open field and in presence of the novel object. NOE vs OF distance travelled, Difference in distance travelled (cm) in presence of the novel object and during initial exposure to open field. RR naive fall time, Fall time on accelerating rotarod (log₁₀ s), naive performance in session 1. RR learning, Learning on rotarod, measured as increase in fall time per trial (s/trial) in session 1. RR memory, Memory on rotarod, measured as excess fall time at middle of session 2 relative to middle of session 1. Fear learning, trial effect, Fear learning, measured as extra % time freezing before third trial compared to % time freezing before first trial. Fear learning, tone effect, Fear learning, measured as increase in % time freezing due to third tone compared to increase in % time freezing due to first tone. Contextual memory, mean, Contextual memory, measured as difference in % time freezing during first 120 s re-exposure to the box compared to first 120 s in the box on previous day. Contextual memory, change, Contextual memory, measured as increase in % time spent freezing from first time bin of 30 s to fourth bin of 30 s during 120 s re-exposure to the box. Cued memory, mean, Cued memory, measured as increase in % time spent freezing during 120 s of tone re-exposure compared to increase in % time spent freezing during initial tone on previous day. Cued memory, change, Cued memory, measured as increase in % time spent freezing from first time bin of 30 s to fourth bin of 30 s during 120 s re-exposure to the tone.
| Variable | Units | Wildtype M (n=12) | Wildtype F (n=11) | Mutant M (n=11) | Mutant F (n=11) | P(sex×mutation) | P(mutation) |
|---|---|---|---|---|---|---|---|
| EPM total distance | cm | 1296 (71) | 1338 (74) | 870 (81) | 929 (67) | 0.91 | 0.0000012 *** |
| EPM max speed | cm/s | 26.8 (0.8) | 26.7 (1.8) | 19.7 (1.1) | 23.2 (1.1) | 0.15 | 0.000074 *** |
| EPM % time in open | % | 13.9 (2.1) | 13.8 (2.7) | 52.1 (6.3) | 31.7 (6.4) | 0.037 * | 0.00000041 *** |
| EPM time in centre | s | 56.1 (6.9) | 52 (4.8) | 37.6 (4.7) | 41.2 (6.8) | 0.52 | 0.017 * |
| EPM max speed, open vs closed | cm/s | -4 (2.2) | -6.9 (2.3) | -5.8 (1.3) | -10.9 (1.7) | 0.57 | 0.14 |
| OF, NOE total distance | log10 cm | 3.65 (0.03) | 3.7 (0.04) | 3.33 (0.05) | 3.47 (0.04) | 0.23 | 0.000000019 *** |
| NOE vs OF distance travelled | cm | -1114 (123) | -1379 (195) | -469 (90) | -479 (162) | 0.39 | 0.0000053 *** |
| RR naive fall time | log10 s | 1.68 (0.04) | 1.66 (0.08) | 1.29 (0.07) | 1.33 (0.05) | 0.59 | 0.00000085 *** |
| RR learning | s/trial | 4.5 (1.2) | 4.9 (1.8) | 0.1 (0.8) | 0.4 (0.7) | 0.98 | 0.00068 *** |
| RR memory | s | 24.2 (7.4) | 32.6 (9) | 13.1 (4.1) | 13 (4.7) | 0.53 | 0.027 * |
| Fear learning, trial effect | % freezing | 24.6 (3.8) | 37.8 (4) | 55.8 (8.7) | 62.2 (6.2) | 0.57 | 0.000032 *** |
| Fear learning, tone effect | % freezing | 4.9 (6.2) | -2.5 (4.4) | 6.4 (5.7) | 0.4 (8.2) | 0.92 | 0.72 |
| Contextual memory, mean | % freezing | 23 (5) | 31.4 (5.6) | 22.2 (5) | 14.5 (4.2) | 0.11 | 0.088 |
| Contextual memory, change | % freezing | 20.2 (5.5) | 24 (7.6) | -2.6 (8.8) | 3.3 (6) | 0.88 | 0.0035 ** |
| Cued memory, mean | % freezing | -0.4 (5.1) | 1.3 (4.3) | 2.6 (8) | 7.3 (4.7) | 0.79 | 0.44 |
| Cued memory, change | % freezing | 2.4 (4.8) | -1.7 (8.9) | 0.6 (8.2) | -10.2 (7.4) | 0.65 | 0.5 |
Elevated Plus Maze
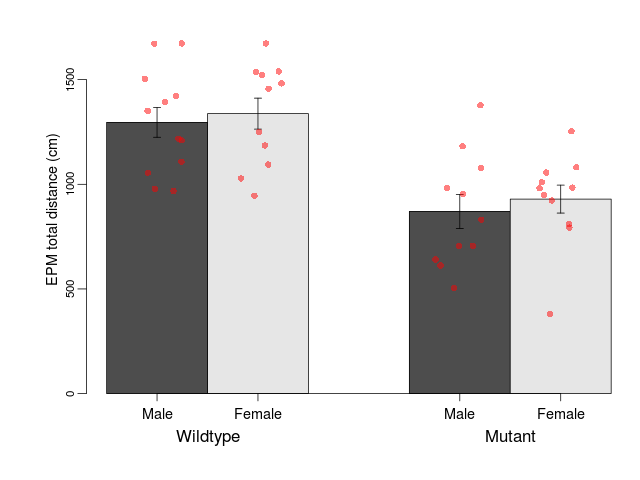
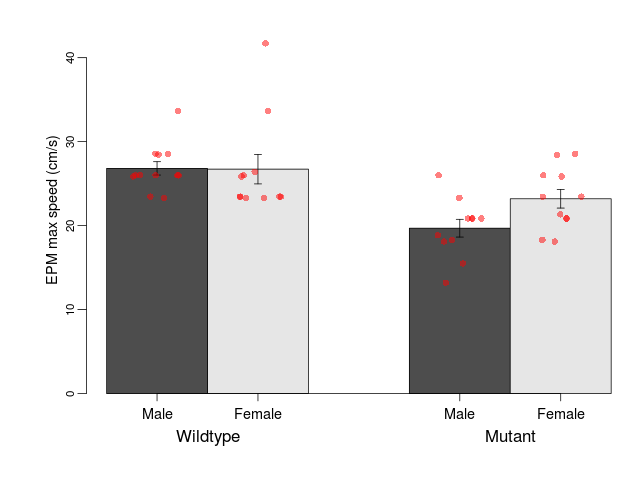
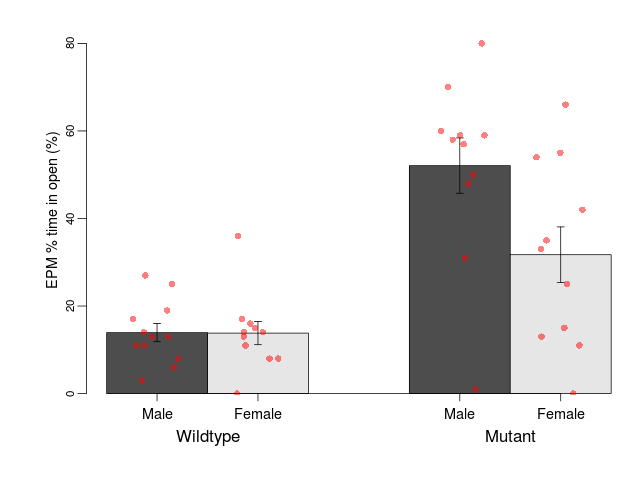
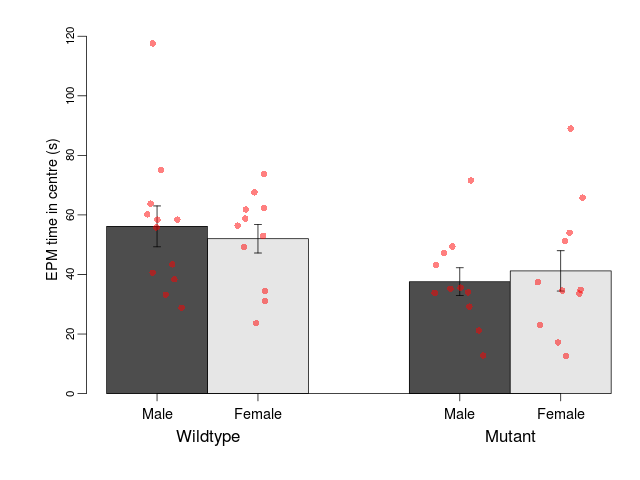
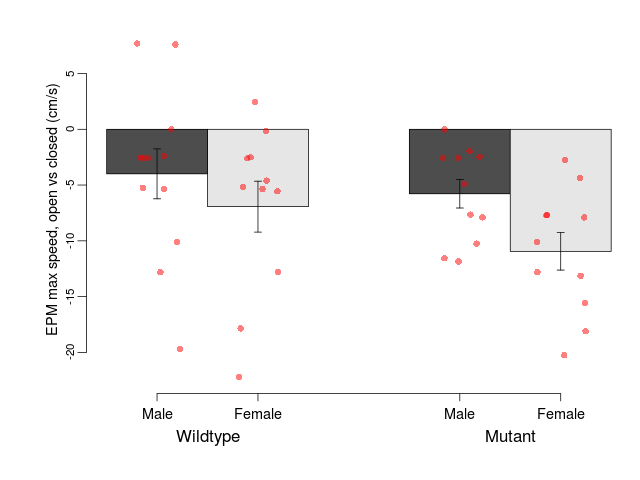
Variables shown are: EPM total distance, Total distance (cm) travelled in any arm or central zone of the EPM. EPM max speed, Maximum speed (cm/s) travelled in any arm or central zone of the EPM. EPM % time in open, Percentage of time in the open or closed arms of the EPM spent in open arms. EPM time in centre, Total time (s) spent in the central zone of the EPM. EPM max speed, open vs closed, Difference between the maximum speed (cm/s) observed in the open arms and the closed arms of the EPM.
| Variable | Units | Wildtype M (n=12) | Wildtype F (n=11) | Mutant M (n=11) | Mutant F (n=11) | P(sex×mutation) | P(mutation) |
|---|---|---|---|---|---|---|---|
| EPM total distance | cm | 1296 (71) | 1338 (74) | 870 (81) | 929 (67) | 0.91 | 0.0000012 *** |
| EPM max speed | cm/s | 26.8 (0.8) | 26.7 (1.8) | 19.7 (1.1) | 23.2 (1.1) | 0.15 | 0.000074 *** |
| EPM % time in open | % | 13.9 (2.1) | 13.8 (2.7) | 52.1 (6.3) | 31.7 (6.4) | 0.037 * | 0.00000041 *** |
| EPM time in centre | s | 56.1 (6.9) | 52 (4.8) | 37.6 (4.7) | 41.2 (6.8) | 0.52 | 0.017 * |
| EPM max speed, open vs closed | cm/s | -4 (2.2) | -6.9 (2.3) | -5.8 (1.3) | -10.9 (1.7) | 0.57 | 0.14 |
Open Field/Novel Object
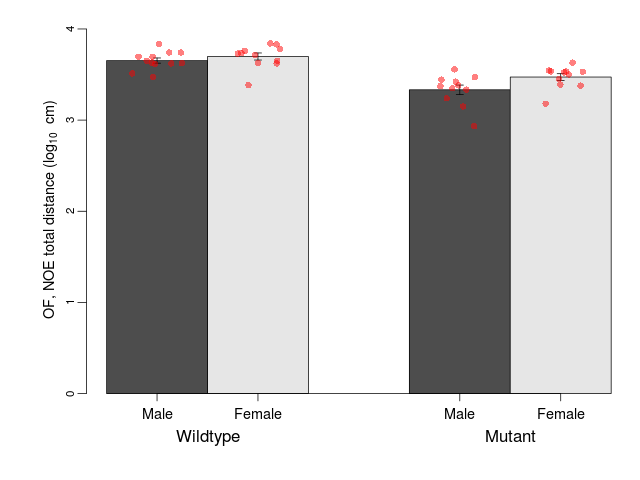
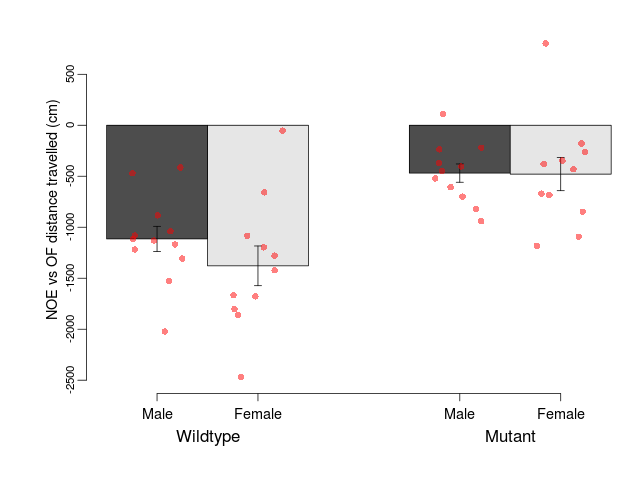
Variables shown are: OF, NOE total distance, Total distance travelled (log₁₀ cm) during initial exposure to the open field and in presence of the novel object. NOE vs OF distance travelled, Difference in distance travelled (cm) in presence of the novel object and during initial exposure to open field.
| Variable | Units | Wildtype M (n=12) | Wildtype F (n=11) | Mutant M (n=11) | Mutant F (n=11) | P(sex×mutation) | P(mutation) |
|---|---|---|---|---|---|---|---|
| OF, NOE total distance | log10 cm | 3.65 (0.03) | 3.7 (0.04) | 3.33 (0.05) | 3.47 (0.04) | 0.23 | 0.000000019 *** |
| NOE vs OF distance travelled | cm | -1114 (123) | -1379 (195) | -469 (90) | -479 (162) | 0.39 | 0.0000053 *** |
Rotarod
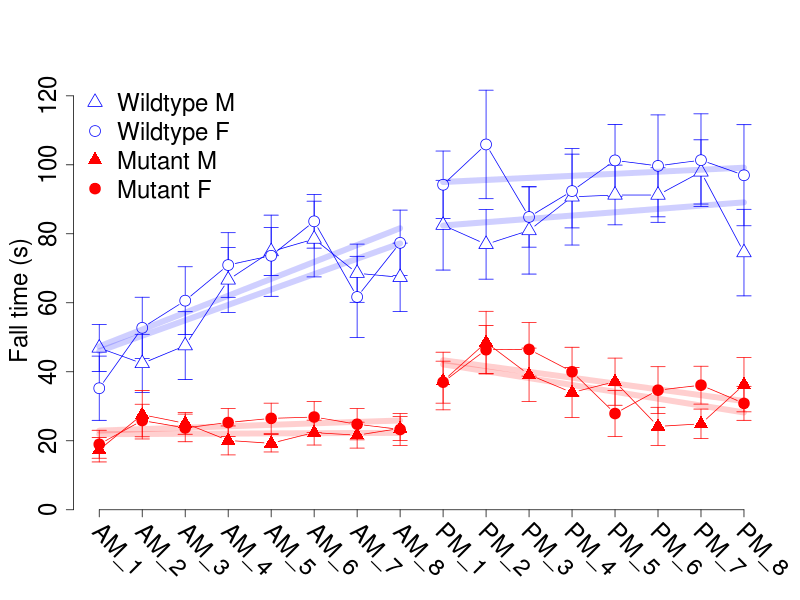
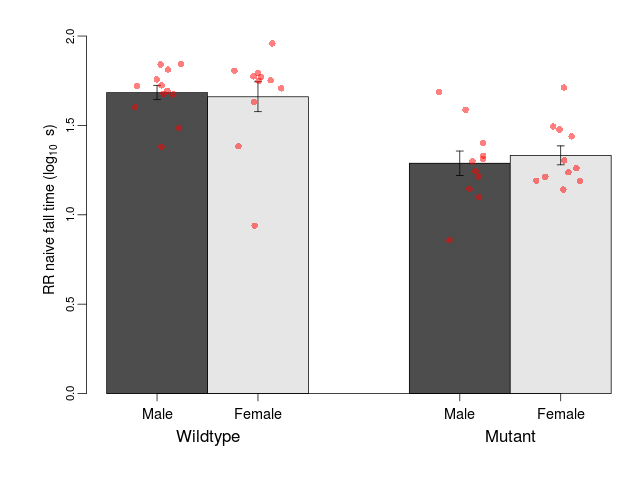
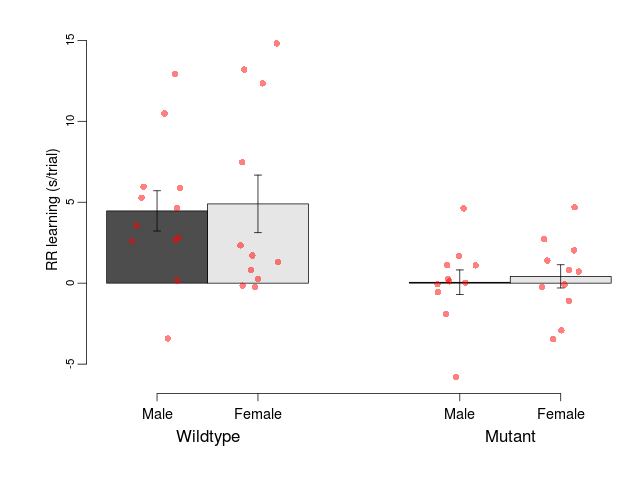
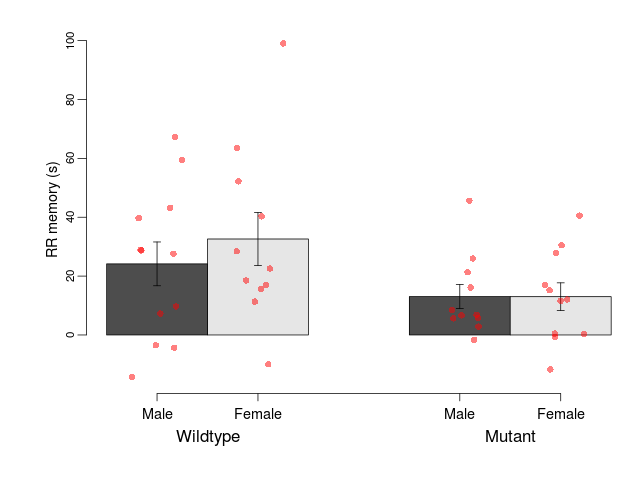
Variables shown are: RR naive fall time, Fall time on accelerating rotarod (log₁₀ s), naive performance in session 1. RR learning, Learning on rotarod, measured as increase in fall time per trial (s/trial) in session 1. RR memory, Memory on rotarod, measured as excess fall time at middle of session 2 relative to middle of session 1.
| Variable | Units | Wildtype M (n=12) | Wildtype F (n=11) | Mutant M (n=11) | Mutant F (n=11) | P(sex×mutation) | P(mutation) |
|---|---|---|---|---|---|---|---|
| RR naive fall time | log10 s | 1.68 (0.04) | 1.66 (0.08) | 1.29 (0.07) | 1.33 (0.05) | 0.59 | 0.00000085 *** |
| RR learning | s/trial | 4.5 (1.2) | 4.9 (1.8) | 0.1 (0.8) | 0.4 (0.7) | 0.98 | 0.00068 *** |
| RR memory | s | 24.2 (7.4) | 32.6 (9) | 13.1 (4.1) | 13 (4.7) | 0.53 | 0.027 * |
Fear Conditioning
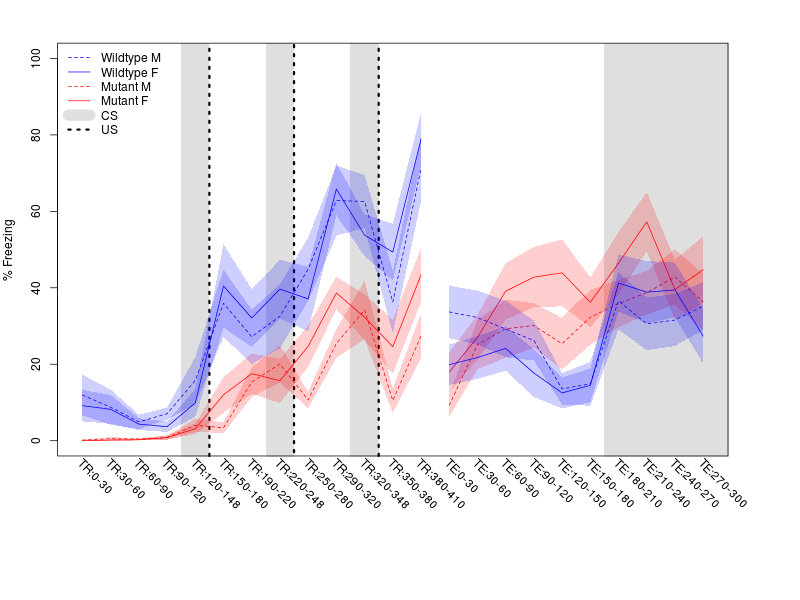
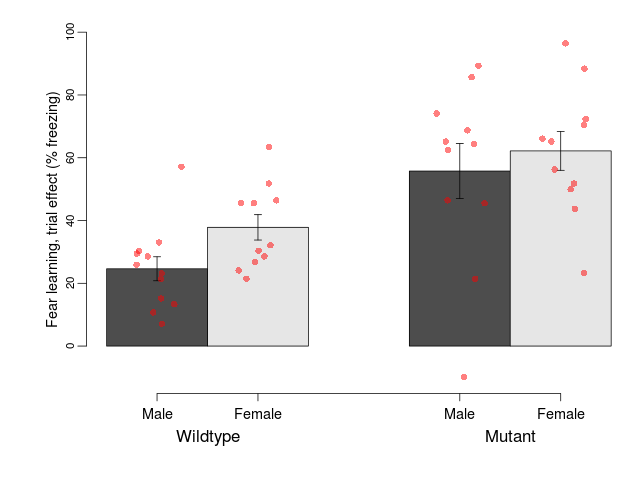
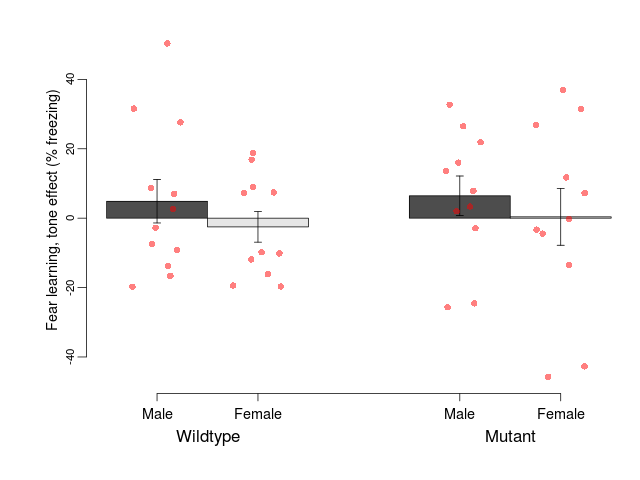
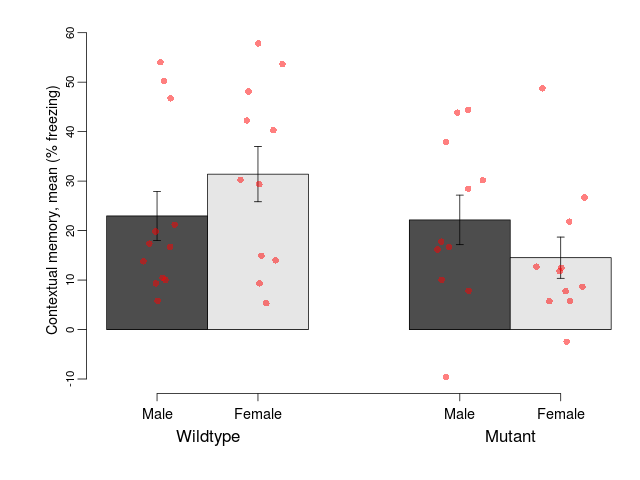
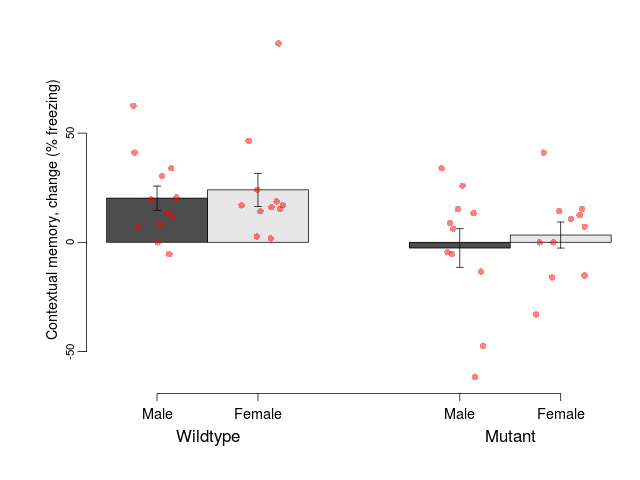
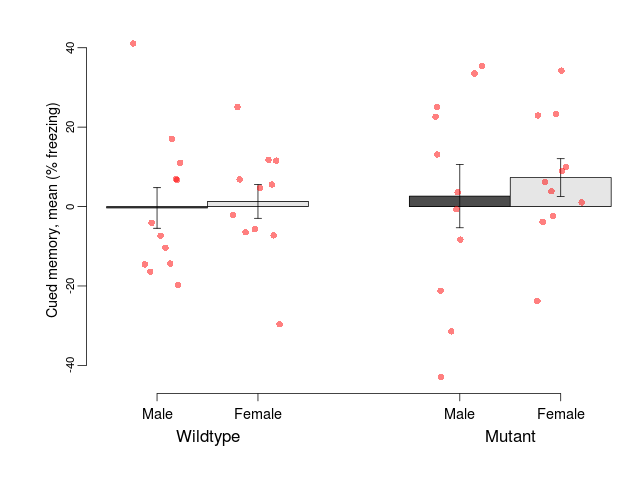
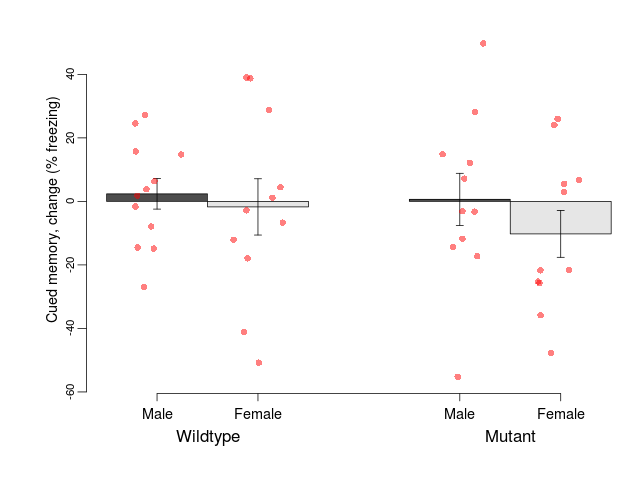
Variables shown are: Fear learning, trial effect, Fear learning, measured as extra % time freezing before third trial compared to % time freezing before first trial. Fear learning, tone effect, Fear learning, measured as increase in % time freezing due to third tone compared to increase in % time freezing due to first tone. Contextual memory, mean, Contextual memory, measured as difference in % time freezing during first 120 s re-exposure to the box compared to first 120 s in the box on previous day. Contextual memory, change, Contextual memory, measured as increase in % time spent freezing from first time bin of 30 s to fourth bin of 30 s during 120 s re-exposure to the box. Cued memory, mean, Cued memory, measured as increase in % time spent freezing during 120 s of tone re-exposure compared to increase in % time spent freezing during initial tone on previous day. Cued memory, change, Cued memory, measured as increase in % time spent freezing from first time bin of 30 s to fourth bin of 30 s during 120 s re-exposure to the tone.
| Variable | Units | Wildtype M (n=12) | Wildtype F (n=11) | Mutant M (n=11) | Mutant F (n=11) | P(sex×mutation) | P(mutation) |
|---|---|---|---|---|---|---|---|
| Fear learning, trial effect | % freezing | 24.6 (3.8) | 37.8 (4) | 55.8 (8.7) | 62.2 (6.2) | 0.57 | 0.000032 *** |
| Fear learning, tone effect | % freezing | 4.9 (6.2) | -2.5 (4.4) | 6.4 (5.7) | 0.4 (8.2) | 0.92 | 0.72 |
| Contextual memory, mean | % freezing | 23 (5) | 31.4 (5.6) | 22.2 (5) | 14.5 (4.2) | 0.11 | 0.088 |
| Contextual memory, change | % freezing | 20.2 (5.5) | 24 (7.6) | -2.6 (8.8) | 3.3 (6) | 0.88 | 0.0035 ** |
| Cued memory, mean | % freezing | -0.4 (5.1) | 1.3 (4.3) | 2.6 (8) | 7.3 (4.7) | 0.79 | 0.44 |
| Cued memory, change | % freezing | 2.4 (4.8) | -1.7 (8.9) | 0.6 (8.2) | -10.2 (7.4) | 0.65 | 0.5 |
- Overview
- Basal Synaptic Transmission
- Paired Pulse Facilitation
- Theta Burst Stimulation
- Long Term Potentiation
Overview
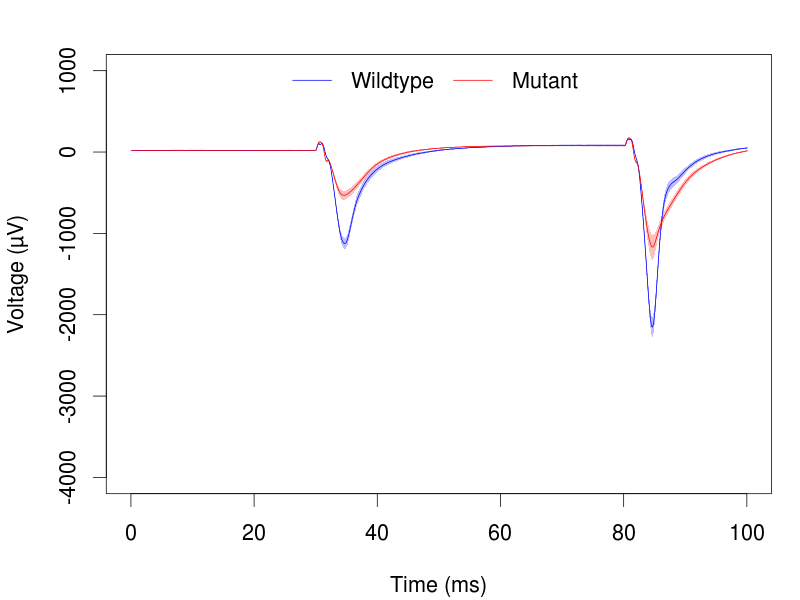
Mutant slices showed extreme overall electrophysiological difference from wildtype slices, with six of nine variables significantly impacted by this mutation. In the basal synaptic transmission experiment, max fEPSP amplitude was significantly decreased in mutants. In the theta burst stimulation experiment, three electrophysiological variables of five were significantly impacted in mutants. In the long term potentiation experiment, two electrophysiological variables of two were significantly impacted in mutants. Only the paired pulse facilitation experiment was unaffected. Note that in the theta burst analysis, the tenth burst is analysed as representative of individual burst amplitude. Definitions of variables may be found below.
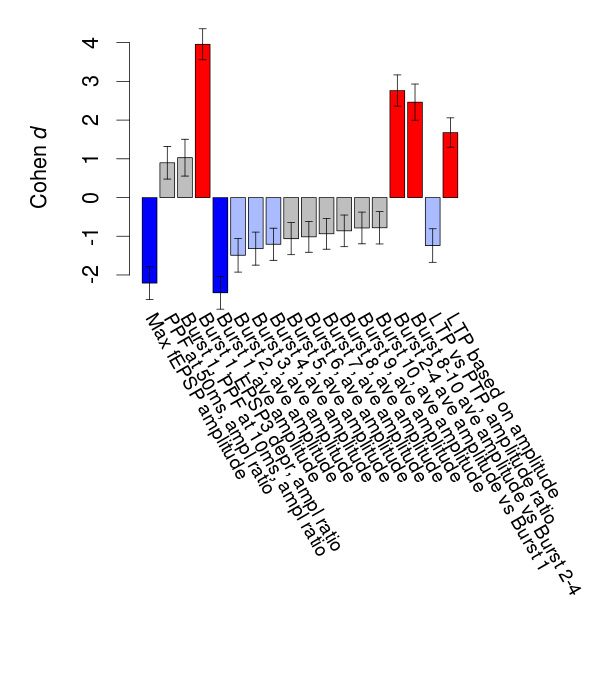
Variables shown are: Max fEPSP amplitude, Maximum field excitatory postsynaptic potential (fEPSP) amplitude. PPF at 50ms, ampl ratio, Paired pulse facilitation (PPF), pulses separated by 50ms, amplitude ratio. Burst 1, PPF at 10ms, ampl ratio, Paired pulse facilitation (PPF), pulses separated by 10ms, amplitude ratio, observed during first two pulses of the first 100Hz burst during theta-burst stimulation. Burst 1, EPSP3 depr, ampl ratio, Depression observed in third fEPSP relative to the second fEPSP of the first 100Hz burst, amplitude ratio. Burst 1, ave amplitude, Average amplitude of four fEPSPs in first burst. Burst 2, ave amplitude, Average amplitude of four fEPSPs in second burst. Burst 3, ave amplitude, Average amplitude of four fEPSPs in third burst. Burst 4, ave amplitude, Average amplitude of four fEPSPs in fourth burst. Burst 5, ave amplitude, Average amplitude of four fEPSPs in fifth burst. Burst 6, ave amplitude, Average amplitude of four fEPSPs in sixth burst. Burst 7, ave amplitude, Average amplitude of four fEPSPs in seventh burst. Burst 8, ave amplitude, Average amplitude of four fEPSPs in eighth burst. Burst 9, ave amplitude, Average amplitude of four fEPSPs in ninth burst. Burst 10, ave amplitude, Average amplitude of four fEPSPs in tenth burst. Burst 2-4 ave amplitude vs Burst 1, Facilitation observed in average amplitude of bursts 2-4, relative to average amplitude of burst 1. Burst 8-10 ave amplitude vs Burst 2-4, Depression observed in average amplitude of bursts 8-10, relative to average amplitude of bursts 2-4. LTP vs PTP, amplitude ratio, Reduction in potentiation from immediately after theta-burst stimulation to one hour later, fEPSP amplitude ratio. LTP based on amplitude, Long term potentiation, ratio of amplitudes of fEPSPs in test pathway and control pathway.
| Variable | Units | Wildtype slices (animals) | Wildtype mean (SEM) | Mutant slices (animals) | Mutant mean (SEM) | P(animals) | P(mutation) |
|---|---|---|---|---|---|---|---|
| Max fEPSP amplitude | µV | 17 (5) | 2770 (160) | 18 (5) | 1360 (140) | 0.043 * | 0.0016 ** |
| PPF at 50ms, ampl ratio | % | 17 (5) | 174.3 (3.4) | 18 (5) | 196 (7.2) | 0.0057 ** | 0.12 |
| Burst 1, PPF at 10ms, ampl ratio | % | 17 (5) | 180 (5.4) | 18 (5) | 217.5 (10.8) | 0.00023 *** | 0.11 |
| Burst 1, EPSP3 depr, ampl ratio | % | 17 (5) | 63.6 (1.8) | 18 (5) | 105.5 (3.1) | 0.00024 *** | 0.00013 *** |
| Burst 1, ave amplitude | µV | 17 (5) | 1197 (67) | 18 (5) | 600 (48) | 0.029 * | 0.00097 *** |
| Burst 2, ave amplitude | µV | 17 (5) | 1900 (120) | 18 (5) | 1110 (130) | 0.048 * | 0.013 * |
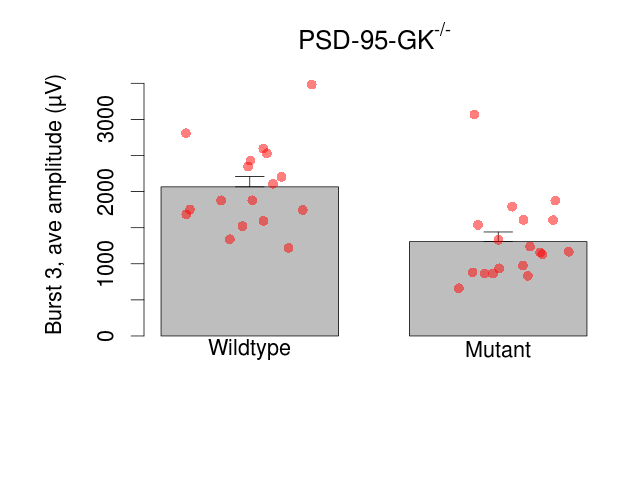
| Burst 3, ave amplitude | µV | 17 (5) | 2070 (140) | 18 (5) | 1310 (130) | 0.032 * | 0.024 * |
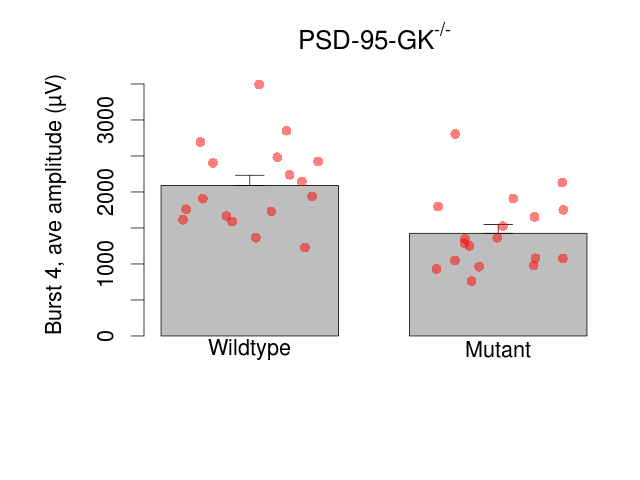
| Burst 4, ave amplitude | µV | 17 (5) | 2090 (140) | 18 (5) | 1430 (120) | 0.028 * | 0.036 * |
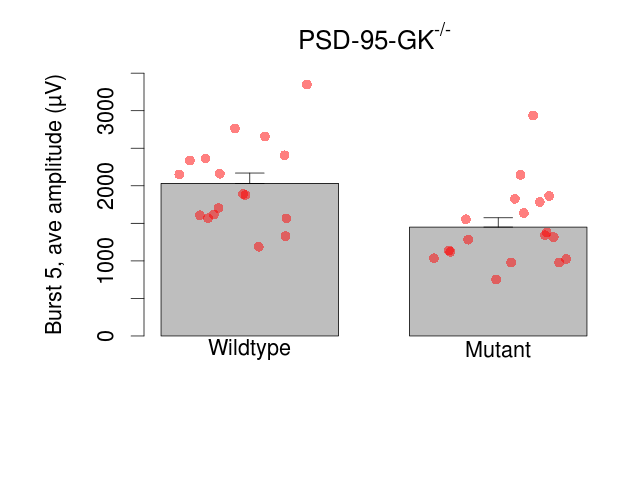
| Burst 5, ave amplitude | µV | 17 (5) | 2030 (140) | 18 (5) | 1450 (120) | 0.035 * | 0.055 |
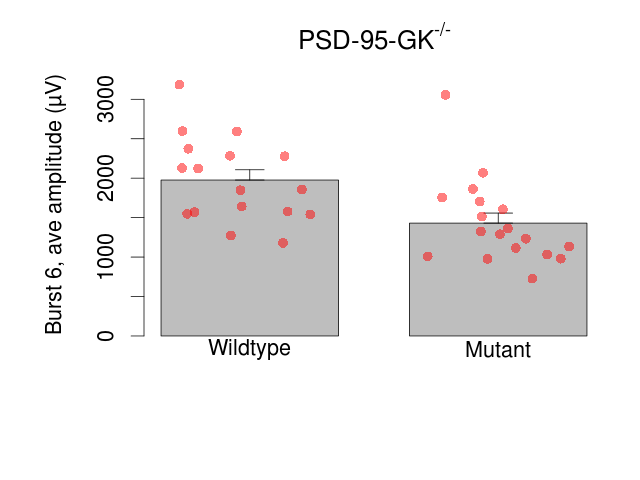
| Burst 6, ave amplitude | µV | 17 (5) | 1980 (130) | 18 (5) | 1430 (130) | 0.047 * | 0.06 |
| Burst 7, ave amplitude | µV | 17 (5) | 1910 (120) | 18 (5) | 1410 (130) | 0.052 | 0.076 |
| Burst 8, ave amplitude | µV | 17 (5) | 1850 (120) | 18 (5) | 1390 (140) | 0.052 | 0.098 |
| Burst 9, ave amplitude | µV | 17 (5) | 1800 (120) | 18 (5) | 1360 (140) | 0.047 * | 0.13 |
| Burst 10, ave amplitude | µV | 17 (5) | 1760 (110) | 18 (5) | 1330 (150) | 0.05 * | 0.13 |
| Burst 2-4 ave amplitude vs Burst 1 | % | 17 (5) | 171.8 (4.8) | 18 (5) | 256.1 (8.9) | 0.13 | 0.00023 *** |
| Burst 8-10 ave amplitude vs Burst 2-4 | % | 17 (5) | 89.8 (1.2) | 18 (5) | 105.2 (1.7) | 0.8 | 5.6e-05 *** |
| LTP vs PTP, amplitude ratio | % | 17 (5) | 79.6 (1.1) | 18 (5) | 72.2 (1.7) | 0.031 * | 0.032 * |
| LTP based on amplitude | % | 17 (5) | 168.6 (3.6) | 18 (5) | 265.1 (18.6) | 0.13 | 0.0046 ** |
Basal Synaptic Transmission
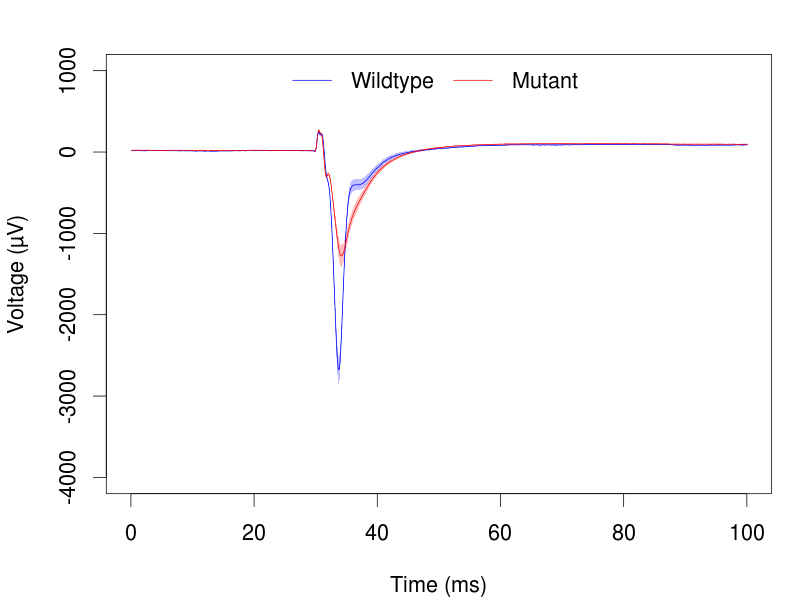
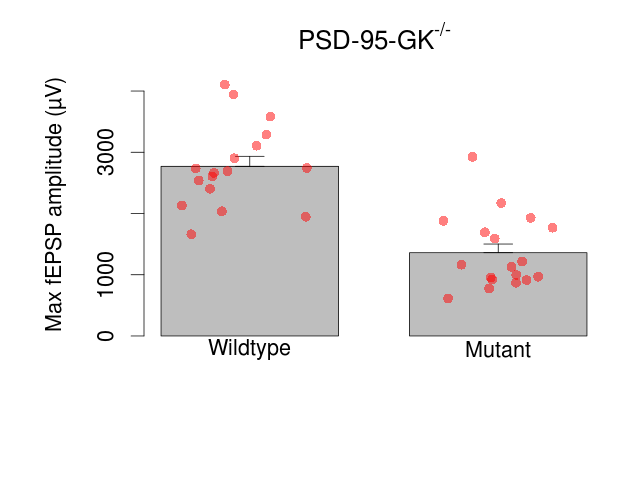
Variables shown are: Max fEPSP amplitude, Maximum field excitatory postsynaptic potential (fEPSP) amplitude.
| Variable | Units | Wildtype slices (animals) | Wildtype mean (SEM) | Mutant slices (animals) | Mutant mean (SEM) | P(animals) | P(mutation) |
|---|---|---|---|---|---|---|---|
| Max fEPSP amplitude | µV | 17 (5) | 2770 (160) | 18 (5) | 1360 (140) | 0.043 * | 0.0016 ** |
Paired Pulse Facilitation
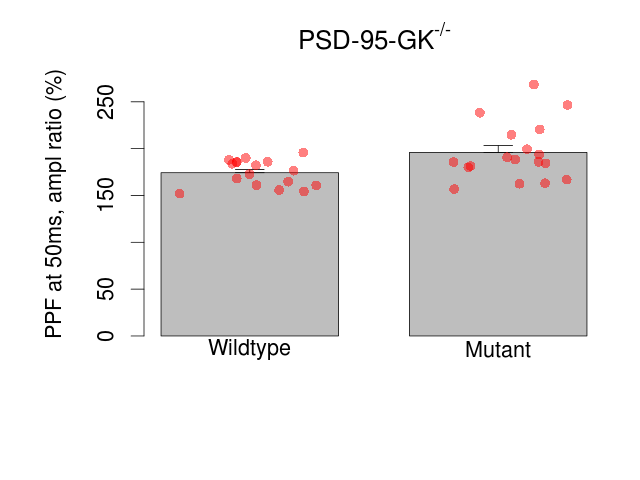
Variables shown are: PPF at 50ms, ampl ratio, Paired pulse facilitation (PPF), pulses separated by 50ms, amplitude ratio.
| Variable | Units | Wildtype slices (animals) | Wildtype mean (SEM) | Mutant slices (animals) | Mutant mean (SEM) | P(animals) | P(mutation) |
|---|---|---|---|---|---|---|---|
| PPF at 50ms, ampl ratio | % | 17 (5) | 174.3 (3.4) | 18 (5) | 196 (7.2) | 0.0057 ** | 0.12 |
Theta Burst Stimulation
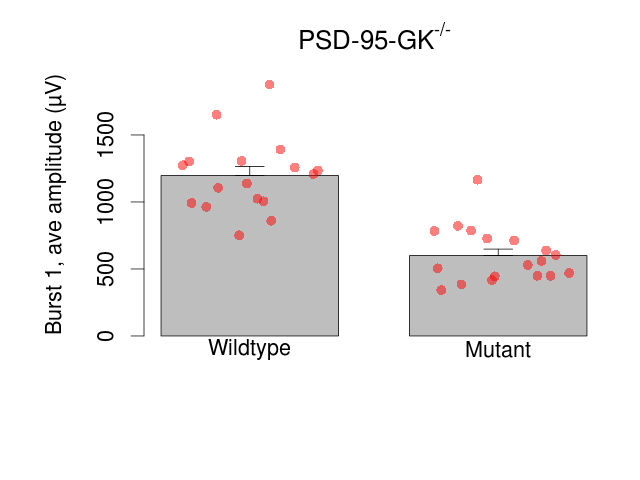
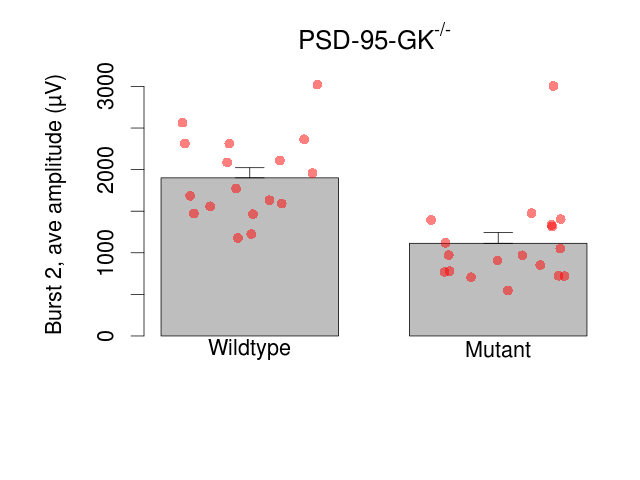
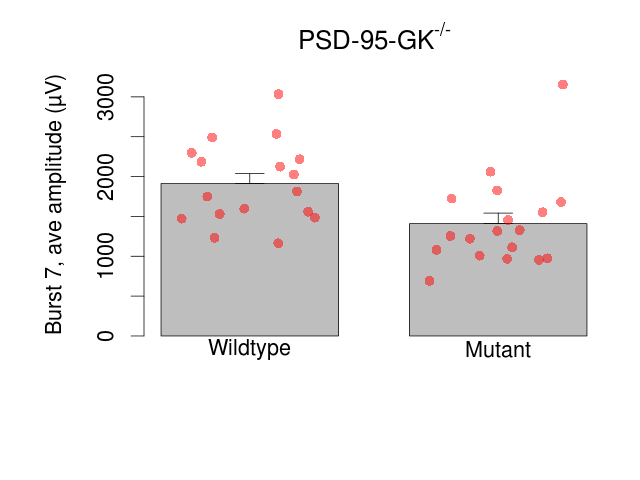
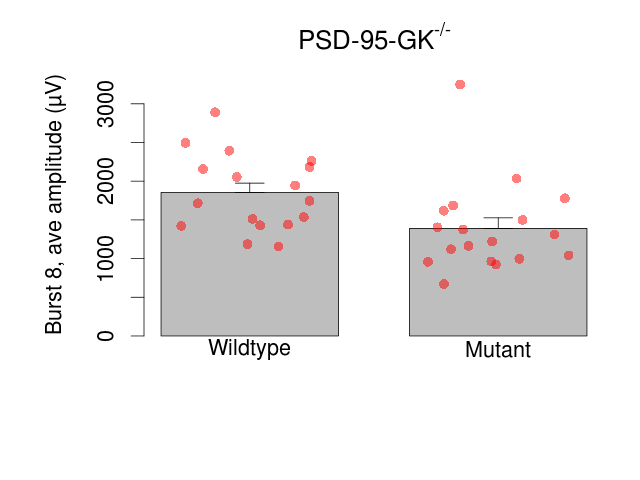
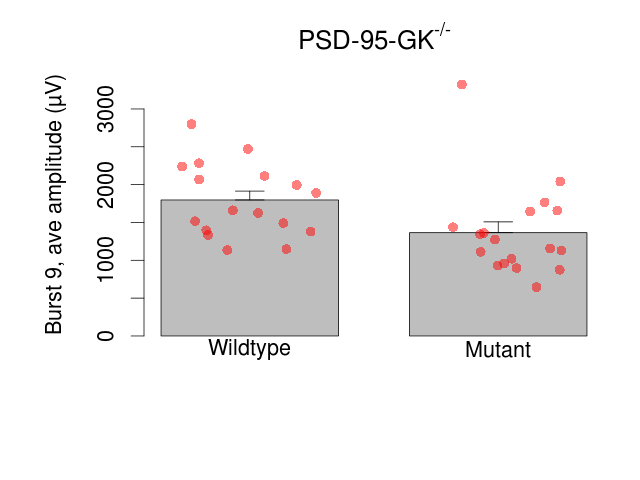
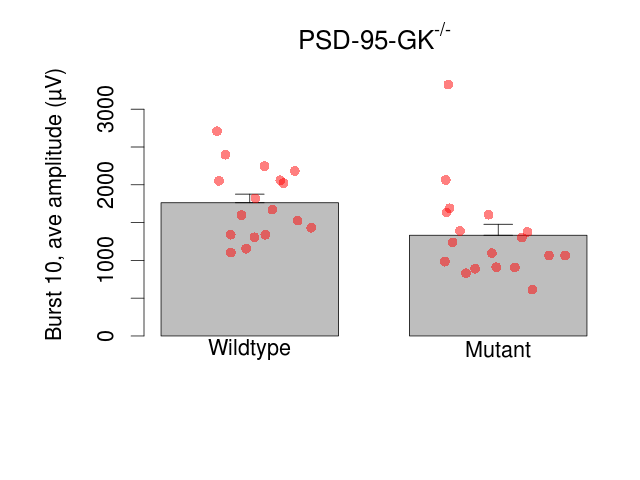
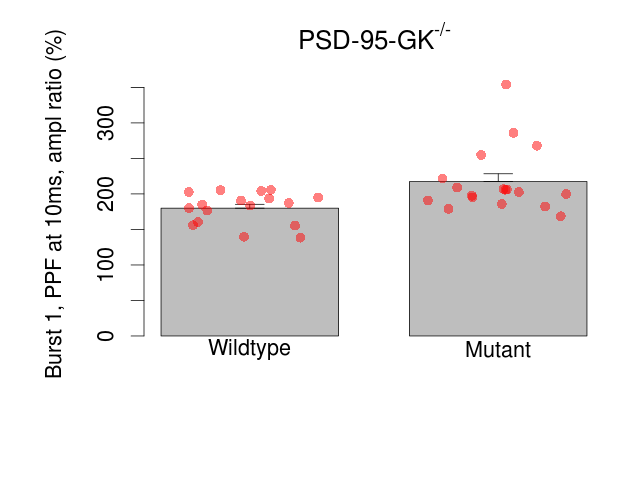
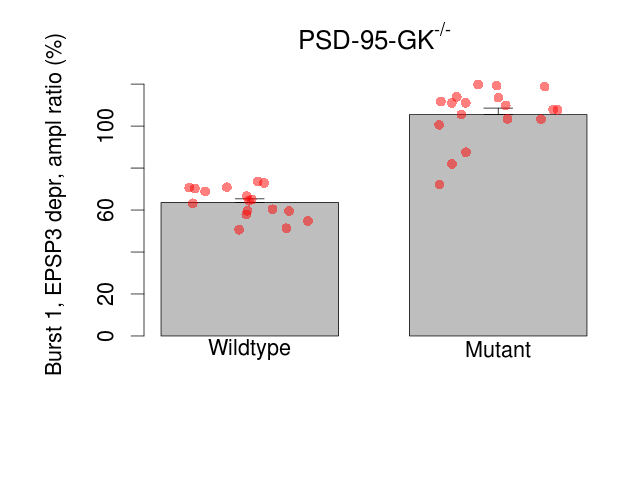
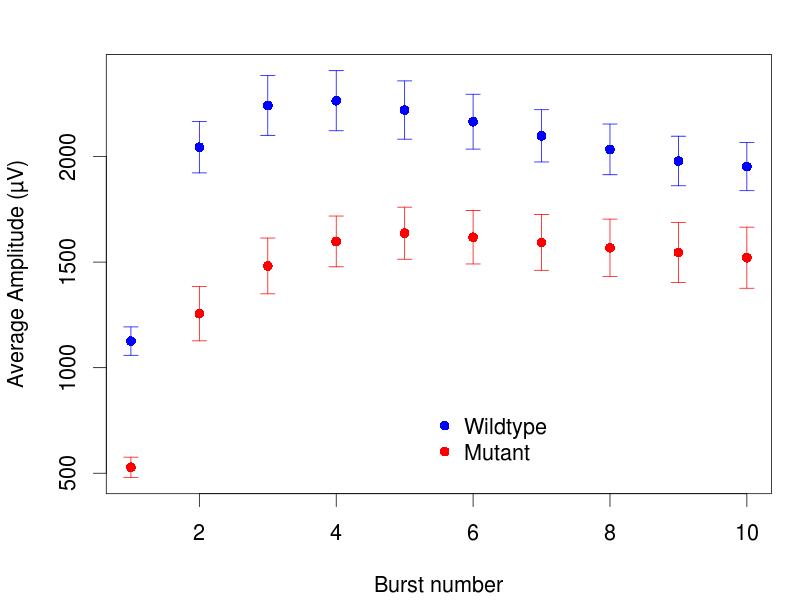
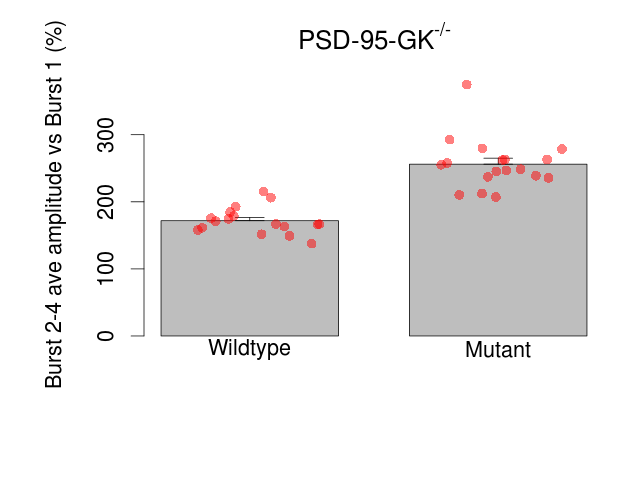
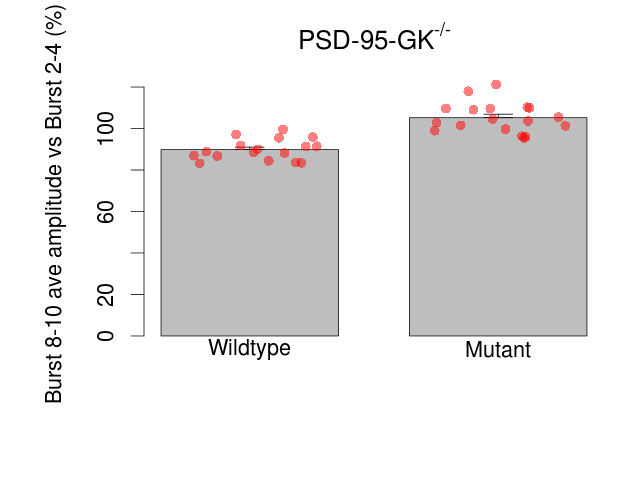
Variables shown are: Burst 1, PPF at 10ms, ampl ratio, Paired pulse facilitation (PPF), pulses separated by 10ms, amplitude ratio, observed during first two pulses of the first 100Hz burst during theta-burst stimulation. Burst 1, EPSP3 depr, ampl ratio, Depression observed in third fEPSP relative to the second fEPSP of the first 100Hz burst, amplitude ratio. Burst 1, ave amplitude, Average amplitude of four fEPSPs in first burst. Burst 2, ave amplitude, Average amplitude of four fEPSPs in second burst. Burst 3, ave amplitude, Average amplitude of four fEPSPs in third burst. Burst 4, ave amplitude, Average amplitude of four fEPSPs in fourth burst. Burst 5, ave amplitude, Average amplitude of four fEPSPs in fifth burst. Burst 6, ave amplitude, Average amplitude of four fEPSPs in sixth burst. Burst 7, ave amplitude, Average amplitude of four fEPSPs in seventh burst. Burst 8, ave amplitude, Average amplitude of four fEPSPs in eighth burst. Burst 9, ave amplitude, Average amplitude of four fEPSPs in ninth burst. Burst 10, ave amplitude, Average amplitude of four fEPSPs in tenth burst. Burst 2-4 ave amplitude vs Burst 1, Facilitation observed in average amplitude of bursts 2-4, relative to average amplitude of burst 1. Burst 8-10 ave amplitude vs Burst 2-4, Depression observed in average amplitude of bursts 8-10, relative to average amplitude of bursts 2-4.
| Variable | Units | Wildtype slices (animals) | Wildtype mean (SEM) | Mutant slices (animals) | Mutant mean (SEM) | P(animals) | P(mutation) |
|---|---|---|---|---|---|---|---|
| Burst 1, PPF at 10ms, ampl ratio | % | 17 (5) | 180 (5.4) | 18 (5) | 217.5 (10.8) | 0.00023 *** | 0.11 |
| Burst 1, EPSP3 depr, ampl ratio | % | 17 (5) | 63.6 (1.8) | 18 (5) | 105.5 (3.1) | 0.00024 *** | 0.00013 *** |
| Burst 1, ave amplitude | µV | 17 (5) | 1197 (67) | 18 (5) | 600 (48) | 0.029 * | 0.00097 *** |
| Burst 2, ave amplitude | µV | 17 (5) | 1900 (120) | 18 (5) | 1110 (130) | 0.048 * | 0.013 * |
| Burst 3, ave amplitude | µV | 17 (5) | 2070 (140) | 18 (5) | 1310 (130) | 0.032 * | 0.024 * |
| Burst 4, ave amplitude | µV | 17 (5) | 2090 (140) | 18 (5) | 1430 (120) | 0.028 * | 0.036 * |
| Burst 5, ave amplitude | µV | 17 (5) | 2030 (140) | 18 (5) | 1450 (120) | 0.035 * | 0.055 |
| Burst 6, ave amplitude | µV | 17 (5) | 1980 (130) | 18 (5) | 1430 (130) | 0.047 * | 0.06 |
| Burst 7, ave amplitude | µV | 17 (5) | 1910 (120) | 18 (5) | 1410 (130) | 0.052 | 0.076 |
| Burst 8, ave amplitude | µV | 17 (5) | 1850 (120) | 18 (5) | 1390 (140) | 0.052 | 0.098 |
| Burst 9, ave amplitude | µV | 17 (5) | 1800 (120) | 18 (5) | 1360 (140) | 0.047 * | 0.13 |
| Burst 10, ave amplitude | µV | 17 (5) | 1760 (110) | 18 (5) | 1330 (150) | 0.05 * | 0.13 |
| Burst 2-4 ave amplitude vs Burst 1 | % | 17 (5) | 171.8 (4.8) | 18 (5) | 256.1 (8.9) | 0.13 | 0.00023 *** |
| Burst 8-10 ave amplitude vs Burst 2-4 | % | 17 (5) | 89.8 (1.2) | 18 (5) | 105.2 (1.7) | 0.8 | 5.6e-05 *** |
Long Term Potentiation
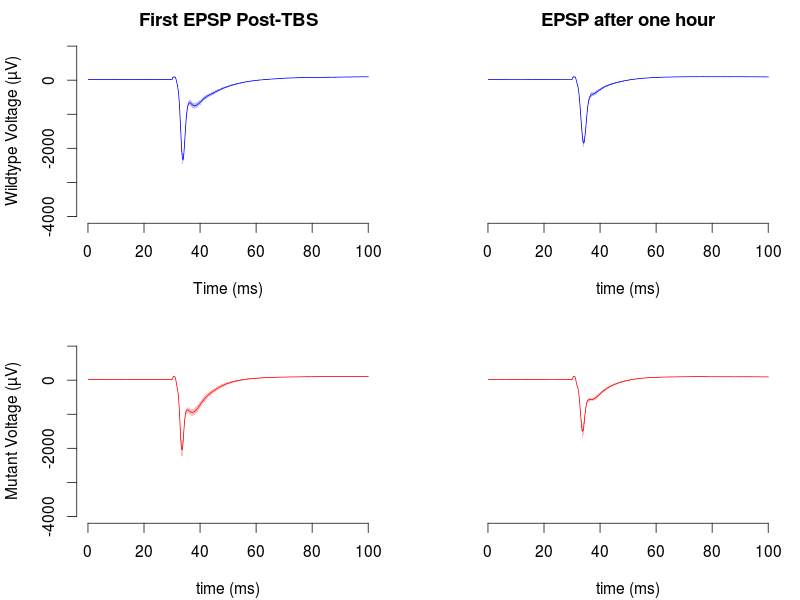
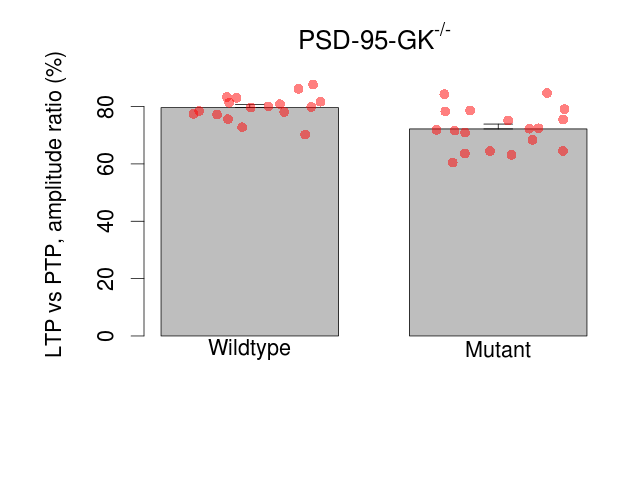
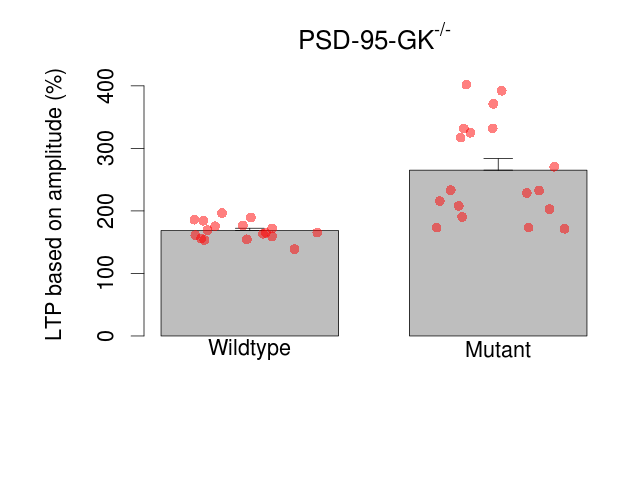
Variables shown are: LTP vs PTP, amplitude ratio, Reduction in potentiation from immediately after theta-burst stimulation to one hour later, fEPSP amplitude ratio. LTP based on amplitude, Long term potentiation, ratio of amplitudes of fEPSPs in test pathway and control pathway.
| Variable | Units | Wildtype slices (animals) | Wildtype mean (SEM) | Mutant slices (animals) | Mutant mean (SEM) | P(animals) | P(mutation) |
|---|---|---|---|---|---|---|---|
| LTP vs PTP, amplitude ratio | % | 17 (5) | 79.6 (1.1) | 18 (5) | 72.2 (1.7) | 0.031 * | 0.032 * |
| LTP based on amplitude | % | 17 (5) | 168.6 (3.6) | 18 (5) | 265.1 (18.6) | 0.13 | 0.0046 ** |
Behaviour raw data
| Animals | View |
| Elevated Plus Maze | View |
| Open Field | View |
| Novel Object Exploration | View |
| Rotarod | View |
Hippocampal slice electrophysiology raw data
| Animals and Brain slices | View |
| Field EPSP (Maximum) | View |
| Paired Pulse Facilitation | View |
| Long Term Potentiation | View |
| Data Files | View |