G2C::Genetics
Drebrin knock-out mouse
S.G.N. Grant and the G2C Consortium
Corresponding email: Seth.Grant@ed.ac.uk
G2CMine Data Warehouse
| Dbn1 @ G2CMine |
Genetic and Genomic Information
| Gene symbol | Dbn1 |
| MGI ID | MGI:1931838 |
| G2Cdb mouse | G00000573 |
| Ensembl mouse | ENSMUSG00000034675 |
| G2Cdb human | G00001822 |
| Ensembl human | ENSG00000113758 |
G2CMine Data Warehouse
G2CMine integrates the scientific findings of the Genes to Cognition Programme that utilised neuroproteomics, psychiatric genetics, high-throughput mouse gene targeting combined with behavioural and electrophysiological phenotyping and informatics in order to develop a general strategy for understanding cognition at the molecular, cellular and systems neuroscience levels.
G2CMine provides comprehensive Gene Ontology, Mammalian Phenotype Ontology, Human Phenotype Ontology, UniProt, genetic and protein interactions, and regional mouse brain expression results, together with the phenotyping results of the G2C Programme.
Mutation
Drebrin mice were supplied by the Mouse Genome Project (Sanger Institute).
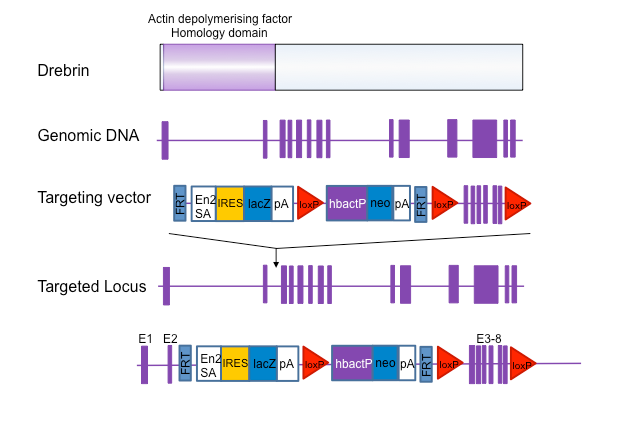
Generation of Dbn1 targeted mice A. Dbn1 is a 14 exon gene which encodes an Actin-depolymerising factor homology domain (top). A selection cassette was inserted into intron 2-3 whilst exons 3-8 were floxed creating a frame shift between exons 2 and 9.
Genotyping
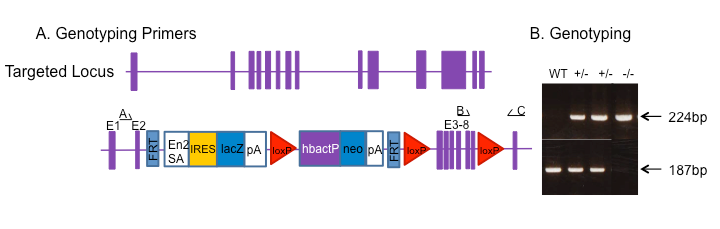
Genomic DNA was isolated from ES cells by Wizard SV 96 Genomic DNA purification system (Promega Cat A2371). Genotyping PCR consisted of a 187bp product amplified from the wild-type (wt) allele using a forward primer B (CTATCATGAGTGTGTCAGGTC) and reverse primer C (CAGAGCCCAAGACTAATACAC). A 224bp product was amplified from the targeted allele using forward primer A (CTTGTCCACGGTTGTCCTTC) with reverse primer C. After enzymatic amplification for 35 cycles (45 seconds at 94 °C, 45 seconds at 55 °C, and 1 minute at 72 °C), the PCR products were size-fractionated on a 2% agarose gel in 1x Tris borate-EDTA buffer.
Primers used for genotyping (A,B & C). PCR genotyping of targeted Drebrin mice using a common reverse primer, C, and forward primers B and A to amplify the wt and mutant alleles respectively.
Expression
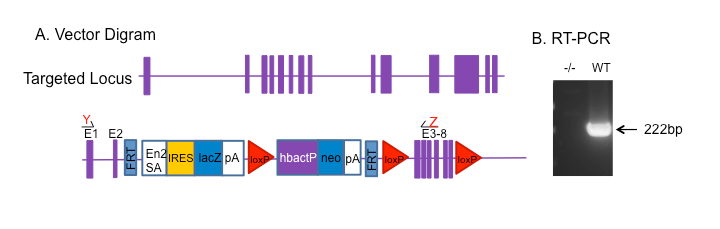
Total RNA was extracted from whole mouse brain using RNeasy Midi kit (Qiagen, Cat 75144). RT-PCR was performed by generating first strand cDNA and using forward primer, Y (GAGGTGATCCGGGAGGAGAG), which anneals to exon 1 and reverse primer, Z (CATCAGGCACATCCTCACCAAC), which anneals to exon 4. A product of 222bp was generated from WT cDNA and no product was detected from homozygous cDNA where the exons have been removed by Cre recombinase.
Primers used for RT-PCR (Y & Z) RT-PCR genotyping using forward primer Y, in exon 1, and reverse primer Z, in exon 4. A product of 222bp was generated from WT cDNA and no product was detected from homozygous cDNA where the exons have been removed by Cre recombinase.
Breeding
Birth of Drebrin-/- mice followed Mendelian ratios with 21% of offspring being homozygous knockouts. Genotypes of 3-week-old pups from Drebrin+/- intercrosses identified 60 wt, 95 Drebrin+/- and 40 Drebrin-/- progeny (Χ2 p= 0.12). Male and female Drebrin-/- mice developed normally to adulthood, exhibited normal body size and no gross abnormalities. Drebrin+/- mice were maintained by backcrossing onto the C57BL/6J (Charles River) background; heterozygous males and females were fertile and used to set up intercrosses to generate homozygous and wildtype mice to study.
- Overview
- Basal Synaptic Transmission
- Paired Pulse Facilitation
- Theta Burst Stimulation
- Long Term Potentiation
Overview
Mutant slices showed little overall electrophysiological difference from wildtype slices, with no electrophysiological variables significantly affected by this mutation. Note that in the theta burst analysis, the tenth burst is analysed as representative of individual burst amplitude.
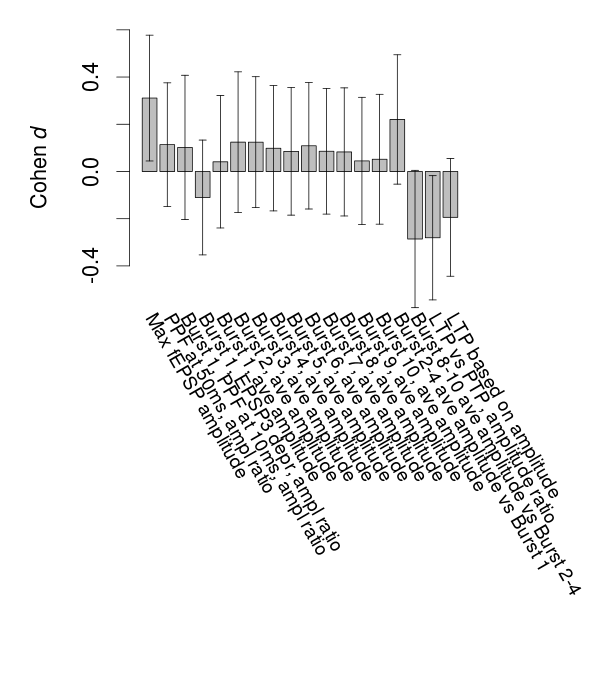
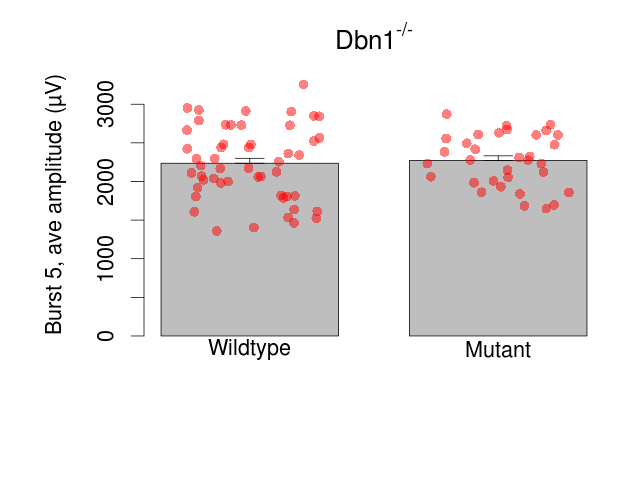
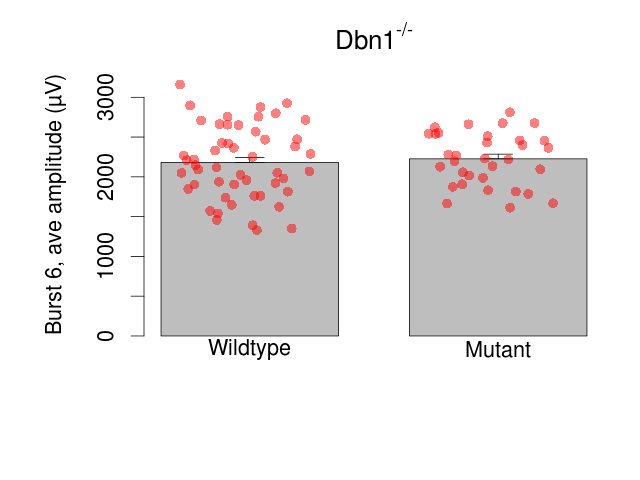
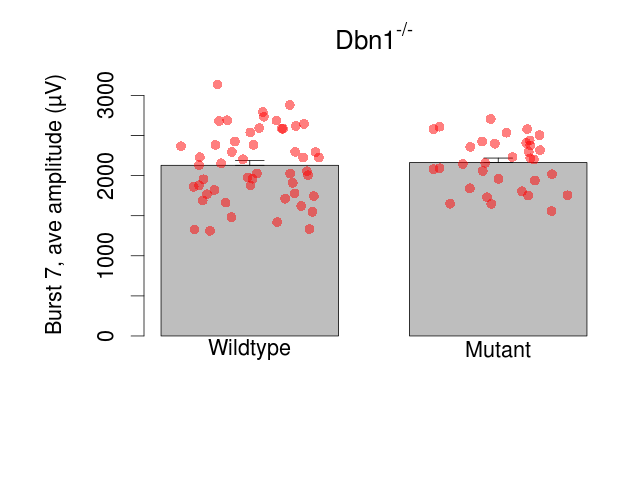
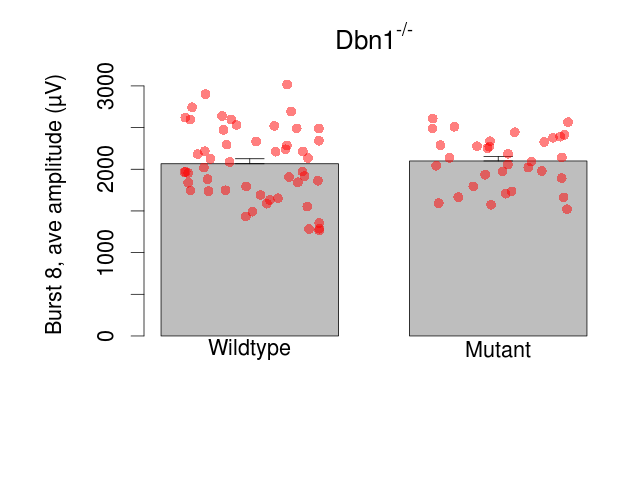
Variables shown are: Max fEPSP amplitude, Maximum field excitatory postsynaptic potential (fEPSP) amplitude. PPF at 50ms, ampl ratio, Paired pulse facilitation (PPF), pulses separated by 50ms, amplitude ratio. Burst 1, PPF at 10ms, ampl ratio, Paired pulse facilitation (PPF), pulses separated by 10ms, amplitude ratio, observed during first two pulses of the first 100Hz burst during theta-burst stimulation. Burst 1, EPSP3 depr, ampl ratio, Depression observed in third fEPSP relative to the second fEPSP of the first 100Hz burst, amplitude ratio. Burst 1, ave amplitude, Average amplitude of four fEPSPs in first burst. Burst 2, ave amplitude, Average amplitude of four fEPSPs in second burst. Burst 3, ave amplitude, Average amplitude of four fEPSPs in third burst. Burst 4, ave amplitude, Average amplitude of four fEPSPs in fourth burst. Burst 5, ave amplitude, Average amplitude of four fEPSPs in fifth burst. Burst 6, ave amplitude, Average amplitude of four fEPSPs in sixth burst. Burst 7, ave amplitude, Average amplitude of four fEPSPs in seventh burst. Burst 8, ave amplitude, Average amplitude of four fEPSPs in eighth burst. Burst 9, ave amplitude, Average amplitude of four fEPSPs in ninth burst. Burst 10, ave amplitude, Average amplitude of four fEPSPs in tenth burst. Burst 2-4 ave amplitude vs Burst 1, Facilitation observed in average amplitude of bursts 2-4, relative to average amplitude of burst 1. Burst 8-10 ave amplitude vs Burst 2-4, Depression observed in average amplitude of bursts 8-10, relative to average amplitude of bursts 2-4. LTP vs PTP, amplitude ratio, Reduction in potentiation from immediately after theta-burst stimulation to one hour later, fEPSP amplitude ratio. LTP based on amplitude, Long term potentiation, ratio of amplitudes of fEPSPs in test pathway and control pathway.
| Variable | Units | Wildtype slices (animals) | Wildtype mean (SEM) | Mutant slices (animals) | Mutant mean (SEM) | P(animals) | P(mutation) |
|---|---|---|---|---|---|---|---|
| Max fEPSP amplitude | µV | 54 (15) | 2771 (85) | 33 (9) | 2975 (123) | 0.19 | 0.23 |
| PPF at 50ms, ampl ratio | % | 54 (15) | 178.9 (2) | 33 (9) | 180.6 (2.6) | 0.061 | 0.68 |
| Burst 1, PPF at 10ms, ampl ratio | % | 51 (14) | 198.1 (3.4) | 33 (9) | 200.6 (4.2) | 0.3 | 0.67 |
| Burst 1, EPSP3 depr, ampl ratio | % | 51 (14) | 62.9 (1.6) | 33 (9) | 61.7 (1.6) | 0.036 * | 0.7 |
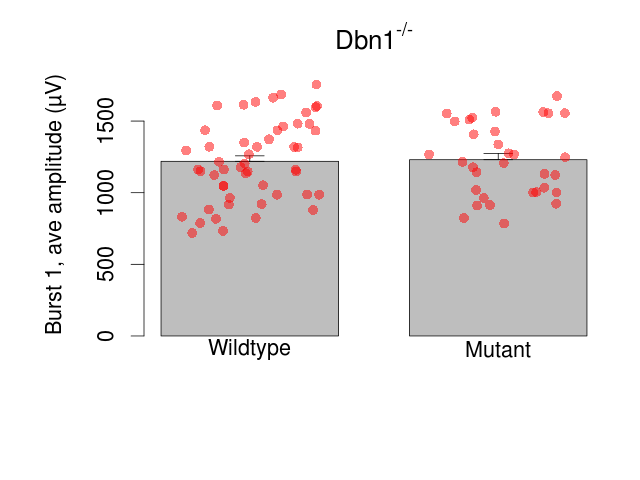
| Burst 1, ave amplitude | µV | 51 (14) | 1219 (39) | 33 (9) | 1230 (44) | 0.018 * | 0.89 |
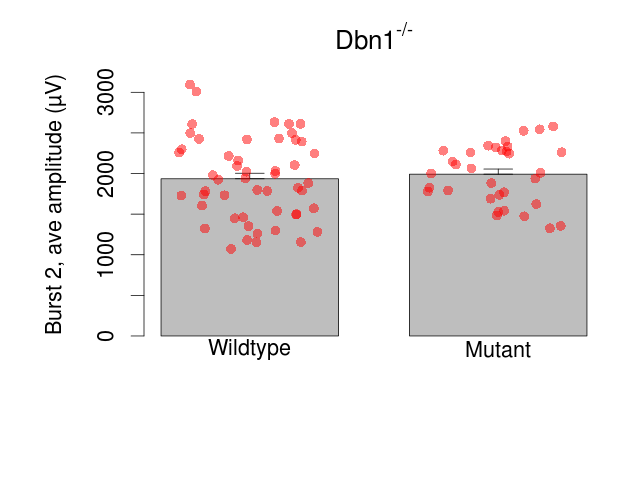
| Burst 2, ave amplitude | µV | 51 (14) | 1935 (71) | 33 (9) | 1992 (63) | 0.03 * | 0.66 |
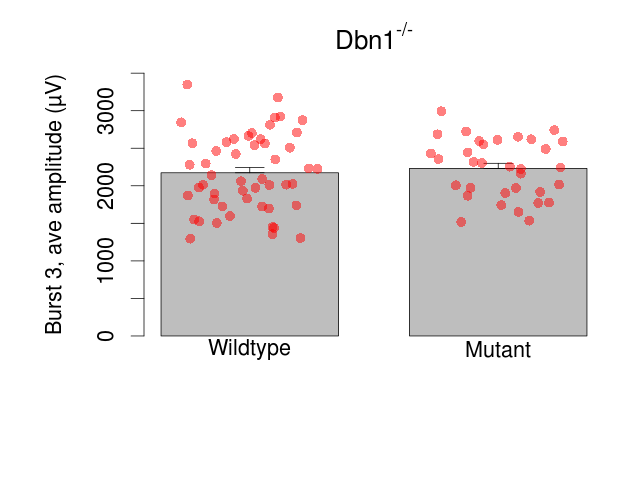
| Burst 3, ave amplitude | µV | 51 (14) | 2173 (72) | 33 (9) | 2232 (68) | 0.064 | 0.65 |
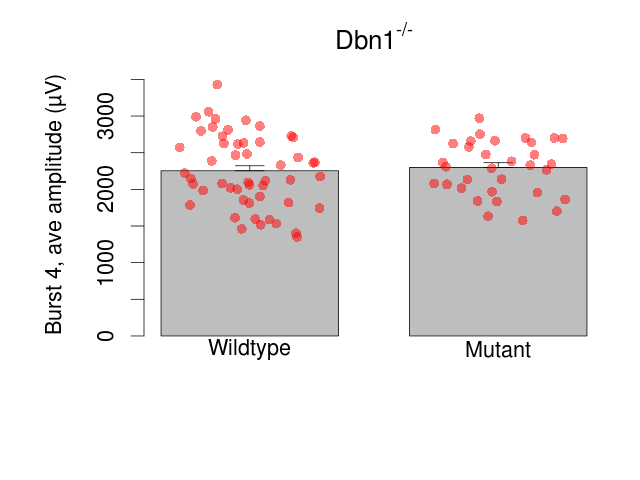
| Burst 4, ave amplitude | µV | 51 (14) | 2254 (70) | 33 (9) | 2298 (65) | 0.087 | 0.71 |
| Burst 5, ave amplitude | µV | 51 (14) | 2236 (66) | 33 (9) | 2272 (60) | 0.072 | 0.75 |
| Burst 6, ave amplitude | µV | 51 (14) | 2181 (64) | 33 (9) | 2226 (58) | 0.069 | 0.69 |
| Burst 7, ave amplitude | µV | 51 (14) | 2129 (62) | 33 (9) | 2163 (56) | 0.084 | 0.75 |
| Burst 8, ave amplitude | µV | 51 (14) | 2066 (62) | 33 (9) | 2099 (55) | 0.072 | 0.76 |
| Burst 9, ave amplitude | µV | 51 (14) | 2021 (61) | 33 (9) | 2038 (53) | 0.068 | 0.87 |
| Burst 10, ave amplitude | µV | 51 (14) | 1973 (62) | 33 (9) | 1993 (55) | 0.05 | 0.85 |
| Burst 2-4 ave amplitude vs Burst 1 | % | 51 (14) | 173.9 (2.5) | 33 (9) | 177.6 (2.7) | 0.038 * | 0.44 |
| Burst 8-10 ave amplitude vs Burst 2-4 | % | 51 (14) | 95.5 (1) | 33 (9) | 93.7 (0.7) | 0.14 | 0.28 |
| LTP vs PTP, amplitude ratio | % | 51 (14) | 80 (0.7) | 33 (9) | 78.6 (0.9) | 0.22 | 0.27 |
| LTP based on amplitude | % | 51 (14) | 170.4 (3) | 33 (9) | 166.6 (2.8) | 0.51 | 0.39 |
Basal Synaptic Transmission
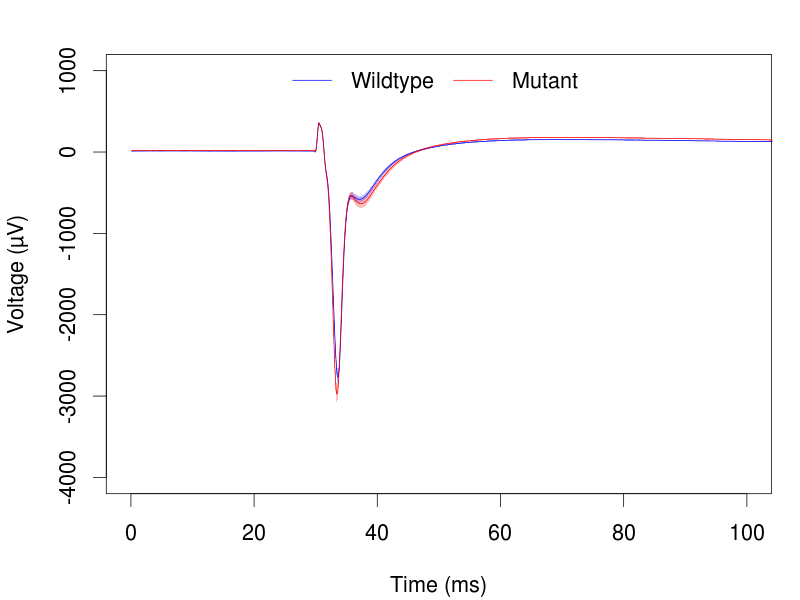
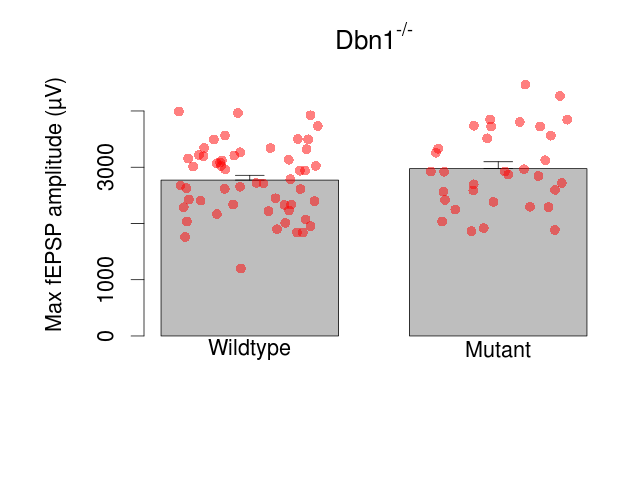
Variables shown are: Max fEPSP amplitude, Maximum field excitatory postsynaptic potential (fEPSP) amplitude.
| Variable | Units | Wildtype slices (animals) | Wildtype mean (SEM) | Mutant slices (animals) | Mutant mean (SEM) | P(animals) | P(mutation) |
|---|---|---|---|---|---|---|---|
| Max fEPSP amplitude | µV | 54 (15) | 2771 (85) | 33 (9) | 2975 (123) | 0.19 | 0.23 |
Paired Pulse Facilitation
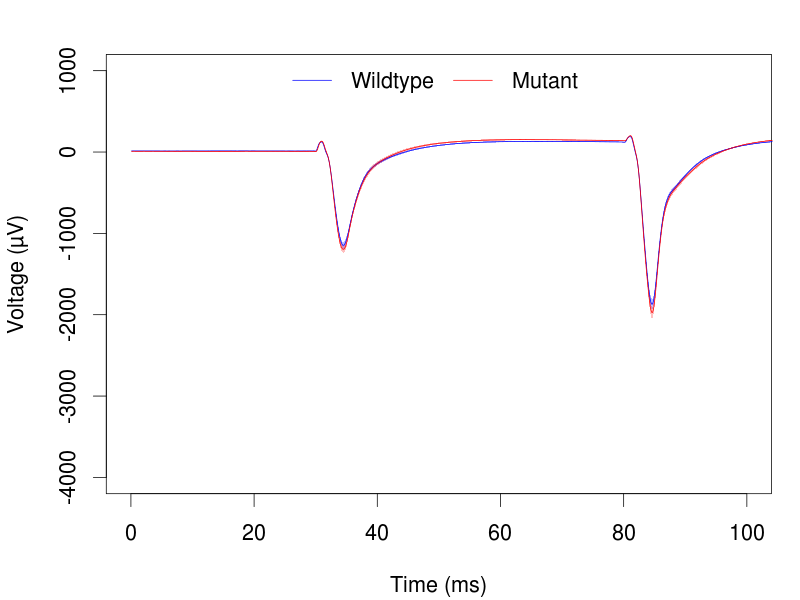
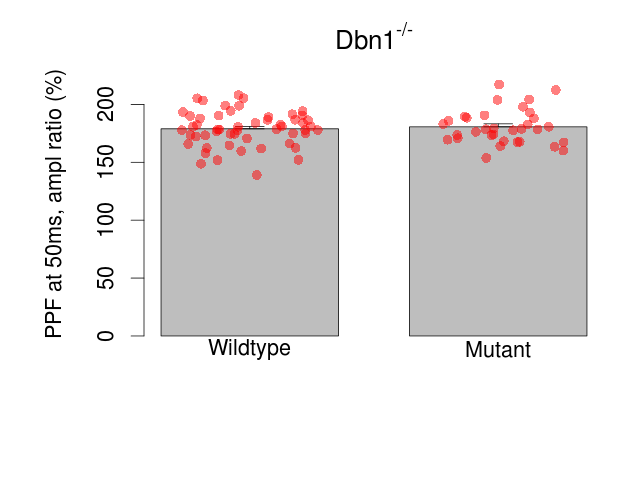
Variables shown are: PPF at 50ms, ampl ratio, Paired pulse facilitation (PPF), pulses separated by 50ms, amplitude ratio.
| Variable | Units | Wildtype slices (animals) | Wildtype mean (SEM) | Mutant slices (animals) | Mutant mean (SEM) | P(animals) | P(mutation) |
|---|---|---|---|---|---|---|---|
| PPF at 50ms, ampl ratio | % | 54 (15) | 178.9 (2) | 33 (9) | 180.6 (2.6) | 0.061 | 0.68 |
Theta Burst Stimulation
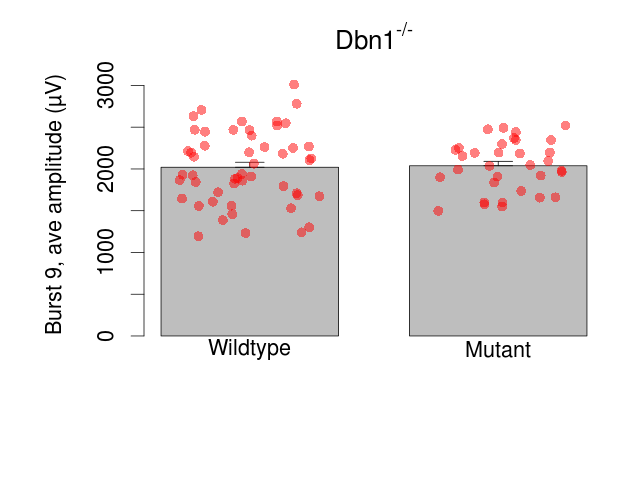
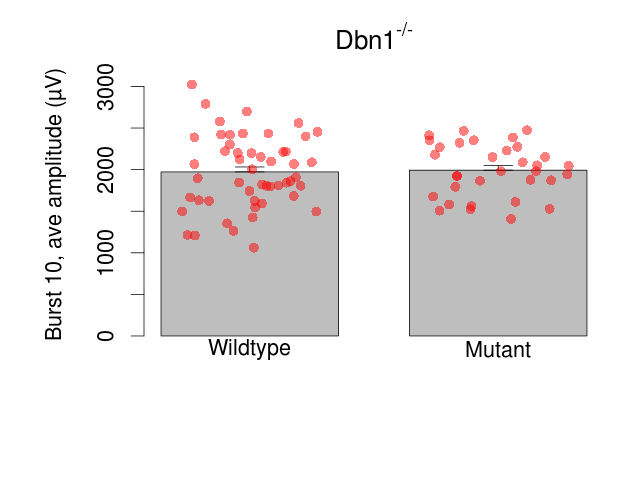
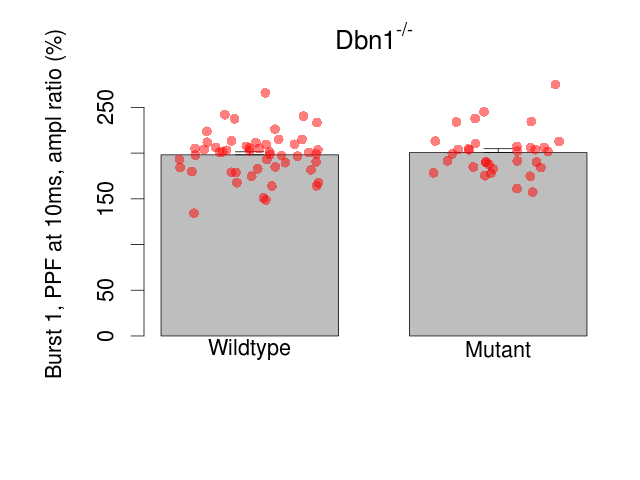
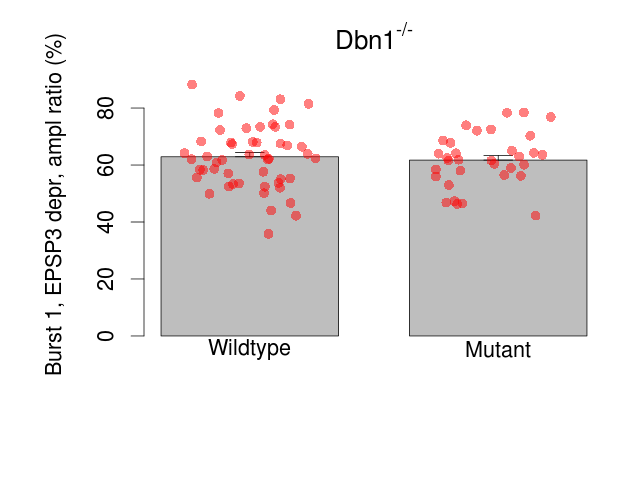
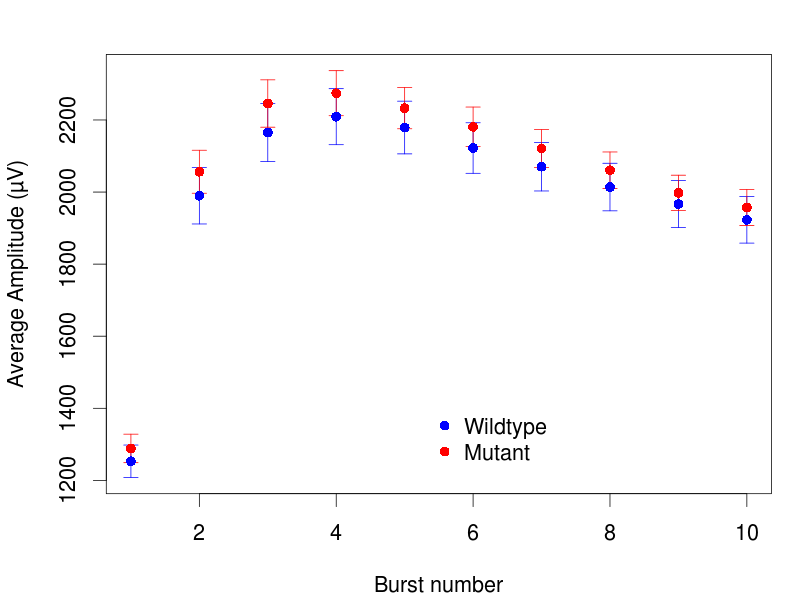
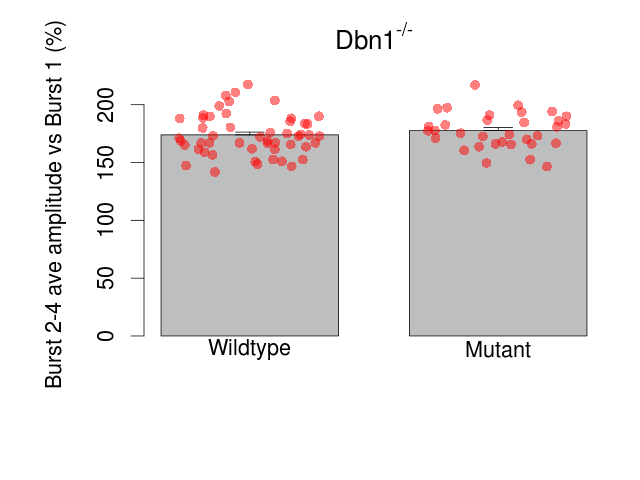
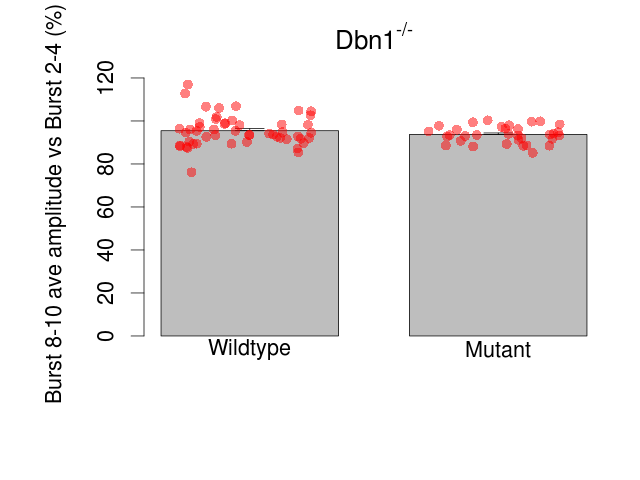
Variables shown are: Burst 1, PPF at 10ms, ampl ratio, Paired pulse facilitation (PPF), pulses separated by 10ms, amplitude ratio, observed during first two pulses of the first 100Hz burst during theta-burst stimulation. Burst 1, EPSP3 depr, ampl ratio, Depression observed in third fEPSP relative to the second fEPSP of the first 100Hz burst, amplitude ratio. Burst 1, ave amplitude, Average amplitude of four fEPSPs in first burst. Burst 2, ave amplitude, Average amplitude of four fEPSPs in second burst. Burst 3, ave amplitude, Average amplitude of four fEPSPs in third burst. Burst 4, ave amplitude, Average amplitude of four fEPSPs in fourth burst. Burst 5, ave amplitude, Average amplitude of four fEPSPs in fifth burst. Burst 6, ave amplitude, Average amplitude of four fEPSPs in sixth burst. Burst 7, ave amplitude, Average amplitude of four fEPSPs in seventh burst. Burst 8, ave amplitude, Average amplitude of four fEPSPs in eighth burst. Burst 9, ave amplitude, Average amplitude of four fEPSPs in ninth burst. Burst 10, ave amplitude, Average amplitude of four fEPSPs in tenth burst. Burst 2-4 ave amplitude vs Burst 1, Facilitation observed in average amplitude of bursts 2-4, relative to average amplitude of burst 1. Burst 8-10 ave amplitude vs Burst 2-4, Depression observed in average amplitude of bursts 8-10, relative to average amplitude of bursts 2-4.
| Variable | Units | Wildtype slices (animals) | Wildtype mean (SEM) | Mutant slices (animals) | Mutant mean (SEM) | P(animals) | P(mutation) |
|---|---|---|---|---|---|---|---|
| Burst 1, PPF at 10ms, ampl ratio | % | 51 (14) | 198.1 (3.4) | 33 (9) | 200.6 (4.2) | 0.3 | 0.67 |
| Burst 1, EPSP3 depr, ampl ratio | % | 51 (14) | 62.9 (1.6) | 33 (9) | 61.7 (1.6) | 0.036 * | 0.7 |
| Burst 1, ave amplitude | µV | 51 (14) | 1219 (39) | 33 (9) | 1230 (44) | 0.018 * | 0.89 |
| Burst 2, ave amplitude | µV | 51 (14) | 1935 (71) | 33 (9) | 1992 (63) | 0.03 * | 0.66 |
| Burst 3, ave amplitude | µV | 51 (14) | 2173 (72) | 33 (9) | 2232 (68) | 0.064 | 0.65 |
| Burst 4, ave amplitude | µV | 51 (14) | 2254 (70) | 33 (9) | 2298 (65) | 0.087 | 0.71 |
| Burst 5, ave amplitude | µV | 51 (14) | 2236 (66) | 33 (9) | 2272 (60) | 0.072 | 0.75 |
| Burst 6, ave amplitude | µV | 51 (14) | 2181 (64) | 33 (9) | 2226 (58) | 0.069 | 0.69 |
| Burst 7, ave amplitude | µV | 51 (14) | 2129 (62) | 33 (9) | 2163 (56) | 0.084 | 0.75 |
| Burst 8, ave amplitude | µV | 51 (14) | 2066 (62) | 33 (9) | 2099 (55) | 0.072 | 0.76 |
| Burst 9, ave amplitude | µV | 51 (14) | 2021 (61) | 33 (9) | 2038 (53) | 0.068 | 0.87 |
| Burst 10, ave amplitude | µV | 51 (14) | 1973 (62) | 33 (9) | 1993 (55) | 0.05 | 0.85 |
| Burst 2-4 ave amplitude vs Burst 1 | % | 51 (14) | 173.9 (2.5) | 33 (9) | 177.6 (2.7) | 0.038 * | 0.44 |
| Burst 8-10 ave amplitude vs Burst 2-4 | % | 51 (14) | 95.5 (1) | 33 (9) | 93.7 (0.7) | 0.14 | 0.28 |
Long Term Potentiation
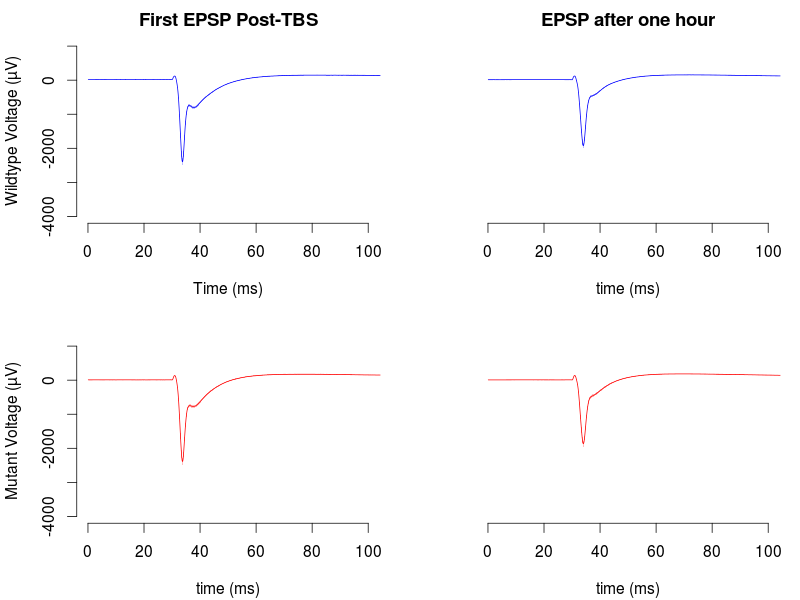
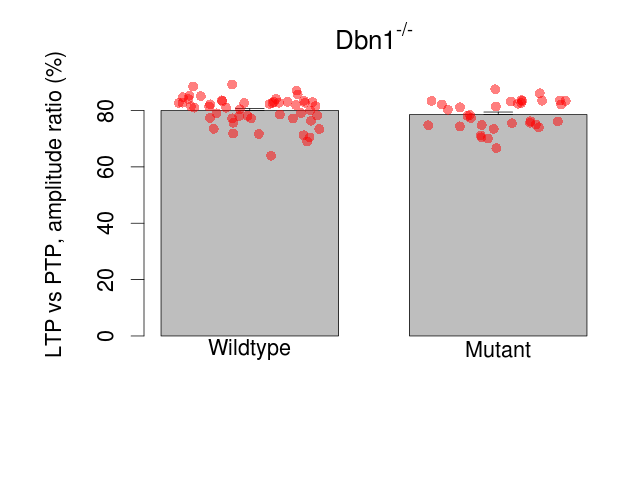
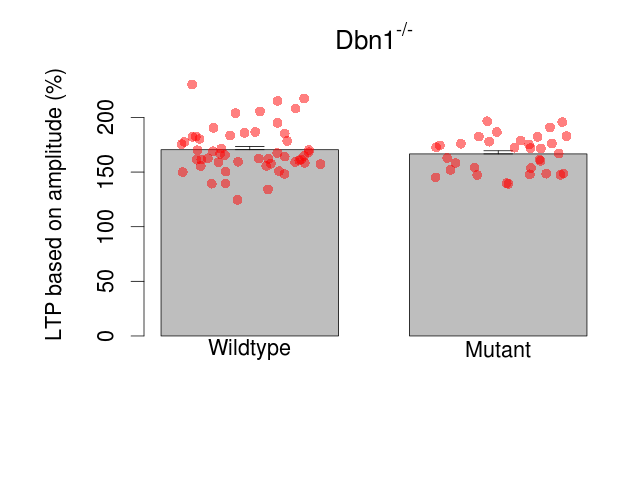
Variables shown are: LTP vs PTP, amplitude ratio, Reduction in potentiation from immediately after theta-burst stimulation to one hour later, fEPSP amplitude ratio. LTP based on amplitude, Long term potentiation, ratio of amplitudes of fEPSPs in test pathway and control pathway.
| Variable | Units | Wildtype slices (animals) | Wildtype mean (SEM) | Mutant slices (animals) | Mutant mean (SEM) | P(animals) | P(mutation) |
|---|---|---|---|---|---|---|---|
| LTP vs PTP, amplitude ratio | % | 51 (14) | 80 (0.7) | 33 (9) | 78.6 (0.9) | 0.22 | 0.27 |
| LTP based on amplitude | % | 51 (14) | 170.4 (3) | 33 (9) | 166.6 (2.8) | 0.51 | 0.39 |
Hippocampal slice electrophysiology raw data
| Animals and Brain slices | View |
| Field EPSP (Maximum) | View |
| Paired Pulse Facilitation | View |
| Long Term Potentiation | View |
| Data Files | View |