G2C::Genetics
Iqsec1 knock-out mouse
S.G.N. Grant and the G2C Consortium
Corresponding email: Seth.Grant@ed.ac.uk
G2CMine Data Warehouse
| Iqsec1 @ G2CMine |
Genetic and Genomic Information
| Gene symbol | Iqsec1 |
| MGI ID | MGI:1196356 |
| G2Cdb mouse | G00001160 |
| Ensembl mouse | ENSMUSG00000034312 |
| G2Cdb human | G00002409 |
| Ensembl human | ENSG00000144711 |
G2CMine Data Warehouse
G2CMine integrates the scientific findings of the Genes to Cognition Programme that utilised neuroproteomics, psychiatric genetics, high-throughput mouse gene targeting combined with behavioural and electrophysiological phenotyping and informatics in order to develop a general strategy for understanding cognition at the molecular, cellular and systems neuroscience levels.
G2CMine provides comprehensive Gene Ontology, Mammalian Phenotype Ontology, Human Phenotype Ontology, UniProt, genetic and protein interactions, and regional mouse brain expression results, together with the phenotyping results of the G2C Programme.
Mutation
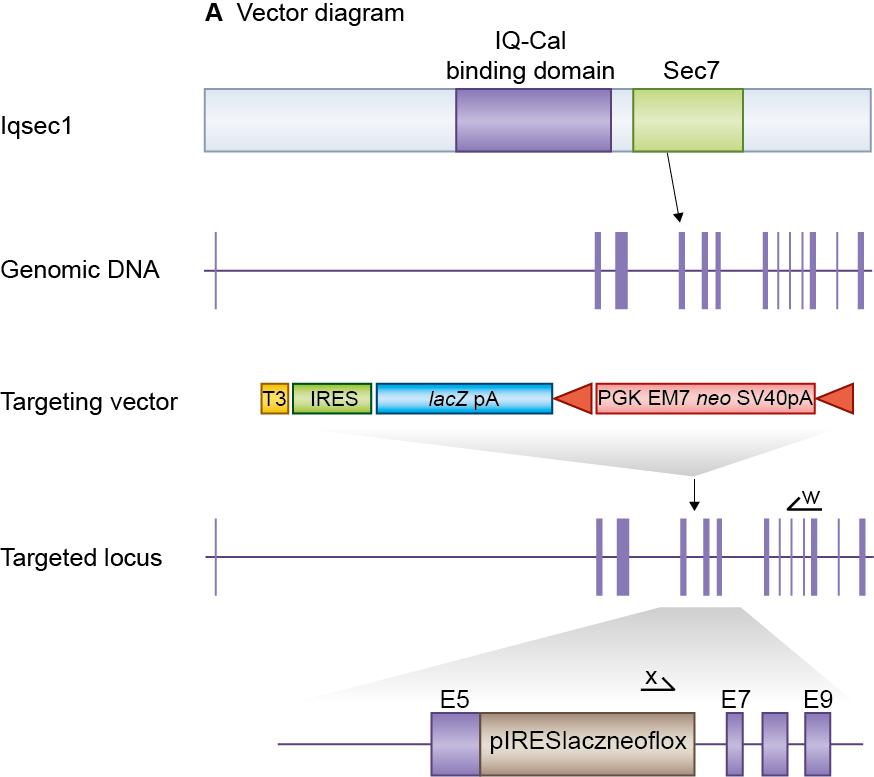
E14TG2a mouse embryonic stem (ES) cells were targeted with a vector containing 6.1kb and 3.2kb of flanking genomic DNA. This replaced 1.5kb of Iqsec1 genomic DNA (X90628029 to X90629529; Ensemble Build 50) with IRES-lacZ-neo cassette. Correctly targeted ES cells were identified by long range PCR using Expand Long Template PCR system (Roche Cat 11681842001). The PCR contained primer X (5’-GAGCTATTCCAGAAGTAGTGAG-3’) and primer W (5’- CCACTCAGACATCATACTGTG -3’) that correspond to sequence in the IRES-lacZ-neo cassette and sequence outside the 3.2kb flanking region respectively.
The correctly targeted ES cells were injected into C57BL/6 blastocysts to create chimeric mice, which were bred with 129S5 mice to generate heterozygous (+/–) Iqsec1 mutant mice. Those F1 heterozygous mice had been backcrossed with 129S5 mice for 1-2 times before being used for intercrossing.
Location of Iqsec1 gene trap. Iqsec1 is a 14 exon gene encoding the Iqsec1 protein which contains a IQ-Cal binding domain and Sec7 domain (top). We replaced Iqsec1 exon 6 with a selection cassette in targeted mice and created a frameshift between exons 5 and 7. Primers used for targeted clone identification (w&x) are shown.
Genotyping
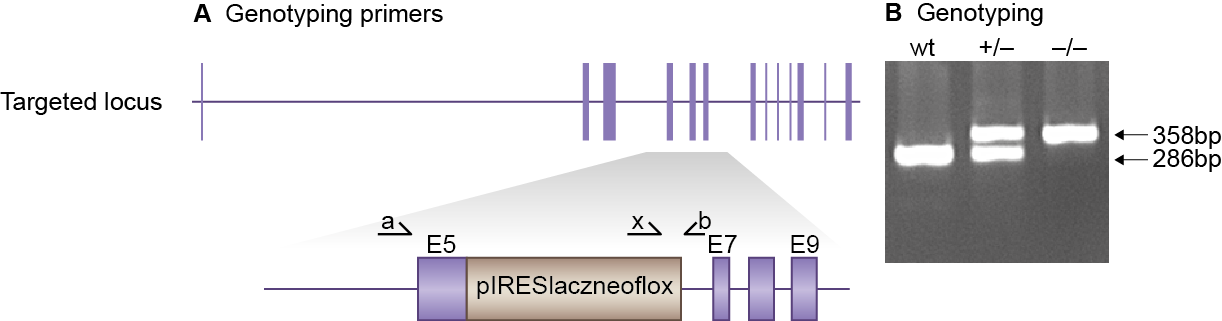
Genomic DNA was isolated from ES cells by Wizard SV 96 Genomic DNA purification system (Promega Cat A2371). Genotyping PCR consisted of a 286bp product amplified from the wild-type (wt) allele using a forward primer A (CAGACACCATCTTCATCCTG) in the wt sequence, deleted by targeted mutation, and a reverse primer B (CACTTCACTCTGTTGAGCATG) downstream of the cassette. A 358bp product was amplified from the targeted allele using primer B with forward primer X, within the selection cassette. After enzymatic amplification for 35 cycles (45 seconds at 94 °C, 45 seconds at 55 °C, and 1 minute at 72 °C), the PCR products were size-fractionated on a 2% agarose gel in 1x Tris borate-EDTA buffer.
Primers used for genotyping (a,b & x). PCR genotyping of targeted Iqsec1 mice using a common reverse primer, b, and forward primers a and x to amplify the wt and mutant alleles respectively.
Expression
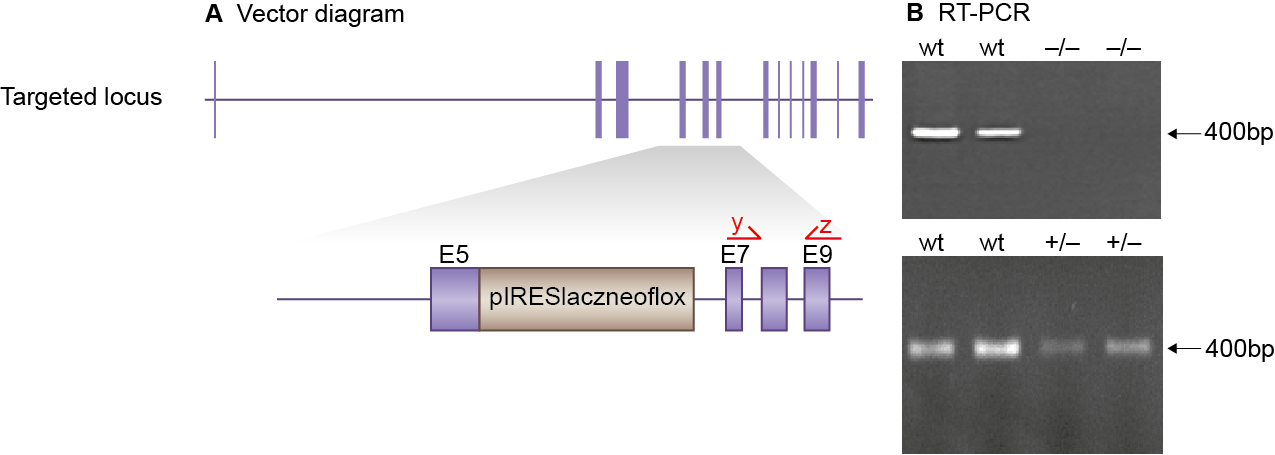
Total RNA was extracted from whole mouse brain using RNeasy Midi kit (Qiagen, Cat 75144). RT-PCR was performed by generating first strand cDNA and using a forward primer, Y (GAGAACTGAAGACCAACGAG), which anneals to exon 7 and a reverse primer, Z (GAAGATCTCTCGCTGGTGTAG), which anneals to exon 9. A product of 400bp was generated from WT cDNA, a reduced signal in heterozygotes and no signal detected from homozygote cDNA where the exons have been replaced by the cassette.
Primers used for RT-PCR (y&z) RT-PCR genotyping - forward primer, Y in exon 7 and reverse primer, Z in exon 9, amplification occurs in wt a reduced signal in heterozygotes and no signal detected from homozygous targeted mice where exon 6 has been replaced by the selection cassette.
Breeding
Birth of Iqsec1-/- mice did not follow Mendelian ratios with 11% of offspring being homozygous knockouts. Genotypes of 3-week-old pups from Iqsec1+/- intercrosses identified 45 wt, 76 Iqsec1+/- and 15 Iqsec1-/- progeny (Χ2 p= 0.001). Male and female Iqsec1-/- mice developed normally to adulthood, exhibited normal body size and no gross abnormalities. Iqsec1 mice were maintained by backcrossing onto the 129S5/SvEvBrd background; heterozygous males and females were fertile and used to set up intercrosses to generate homozygous, heterozygous and wildtype mice to study.
Overview
Mutant mice showed little overall behavioural difference from wildtypes. With heterozygous genotype and no behavioural variables significantly affected in mutants, this mutation was deemed haplosufficient.
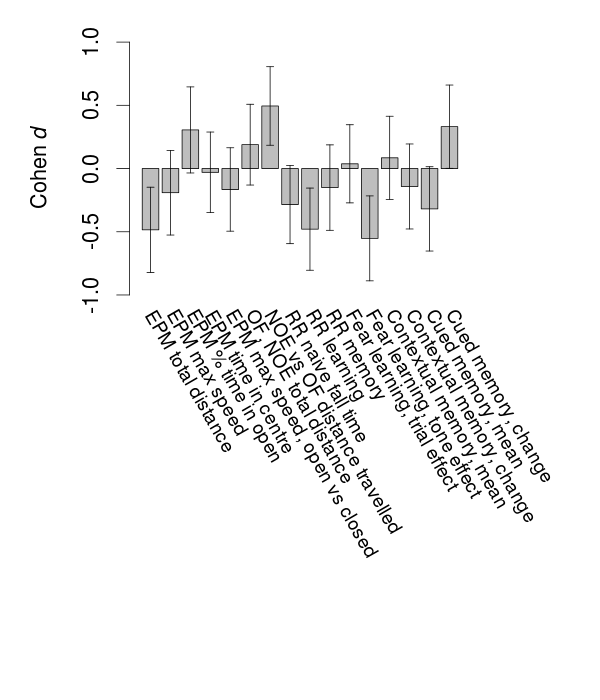
Variables shown are: EPM total distance, Total distance (cm) travelled in any arm or central zone of the EPM. EPM max speed, Maximum speed (cm/s) travelled in any arm or central zone of the EPM. EPM % time in open, Percentage of time in the open or closed arms of the EPM spent in open arms. EPM time in centre, Total time (s) spent in the central zone of the EPM. EPM max speed, open vs closed, Difference between the maximum speed (cm/s) observed in the open arms and the closed arms of the EPM. OF, NOE total distance, Total distance travelled (log₁₀ cm) during initial exposure to the open field and in presence of the novel object. NOE vs OF distance travelled, Difference in distance travelled (cm) in presence of the novel object and during initial exposure to open field. RR naive fall time, Fall time on accelerating rotarod (log₁₀ s), naive performance in session 1. RR learning, Learning on rotarod, measured as increase in fall time per trial (s/trial) in session 1. RR memory, Memory on rotarod, measured as excess fall time at middle of session 2 relative to middle of session 1. Fear learning, trial effect, Fear learning, measured as extra % time freezing before third trial compared to % time freezing before first trial. Fear learning, tone effect, Fear learning, measured as increase in % time freezing due to third tone compared to increase in % time freezing due to first tone. Contextual memory, mean, Contextual memory, measured as difference in % time freezing during first 120 s re-exposure to the box compared to first 120 s in the box on previous day. Contextual memory, change, Contextual memory, measured as increase in % time spent freezing from first time bin of 30 s to fourth bin of 30 s during 120 s re-exposure to the box. Cued memory, mean, Cued memory, measured as increase in % time spent freezing during 120 s of tone re-exposure compared to increase in % time spent freezing during initial tone on previous day. Cued memory, change, Cued memory, measured as increase in % time spent freezing from first time bin of 30 s to fourth bin of 30 s during 120 s re-exposure to the tone.
| Variable | Units | Wildtype M (n=10) | Wildtype F (n=10) | Mutant M (n=10) | Mutant F (n=11) | P(sex×mutation) | P(mutation) |
|---|---|---|---|---|---|---|---|
| EPM total distance | cm | 983 (106) | 793 (74) | 879 (96) | 643 (49) | 0.78 | 0.13 |
| EPM max speed | cm/s | 17.8 (0.9) | 16.9 (1.2) | 18.2 (1.6) | 15.2 (0.8) | 0.4 | 0.57 |
| EPM % time in open | % | 35.2 (8.5) | 31.9 (7.5) | 34.8 (9.9) | 47.1 (6.6) | 0.35 | 0.36 |
| EPM time in centre | s | 169 (16) | 165 (16) | 129 (18) | 198 (12) | 0.024 * | 0.88 |
| EPM max speed, open vs closed | cm/s | -2 (2.3) | -1.9 (1.5) | -5.2 (2) | -0.8 (1.2) | 0.23 | 0.58 |
| OF, NOE total distance | log10 cm | 3.17 (0.08) | 2.98 (0.07) | 3.11 (0.06) | 3.13 (0.09) | 0.19 | 0.54 |
| NOE vs OF distance travelled | cm | -443 (145) | -175 (49) | -214 (117) | 44 (210) | 0.97 | 0.14 |
| RR naive fall time | log10 s | 1 (0.15) | 1.24 (0.09) | 1.1 (0.11) | 0.94 (0.1) | 0.088 | 0.37 |
| RR learning | s/trial | 2.6 (0.7) | 1.8 (0.9) | 1.8 (0.6) | 0.7 (0.4) | 0.88 | 0.15 |
| RR memory | s | 2.5 (2.1) | 11.4 (4.1) | 4.5 (2.9) | 6.3 (2.8) | 0.25 | 0.6 |
| Fear learning, trial effect | % freezing | 40.5 (8.4) | 64.2 (8.3) | 44.6 (8.6) | 61.3 (7.1) | 0.67 | 0.95 |
| Fear learning, tone effect | % freezing | 11.6 (5.8) | 4.9 (7.2) | 4.9 (6.8) | -9.6 (5.2) | 0.54 | 0.095 |
| Contextual memory, mean | % freezing | 32.6 (6.8) | 57.2 (8.1) | 40.2 (8.5) | 53.1 (5.4) | 0.42 | 0.83 |
| Contextual memory, change | % freezing | 20.9 (4.3) | 21.7 (7.8) | 18.2 (8) | 17.9 (8.7) | 0.94 | 0.67 |
| Cued memory, mean | % freezing | -6.7 (5.6) | -4.8 (7.7) | -9.6 (7.1) | -14.3 (5.4) | 0.61 | 0.34 |
| Cued memory, change | % freezing | -8.4 (6.8) | -16.5 (11.7) | -12.7 (8.7) | 5.6 (8) | 0.15 | 0.31 |
Elevated Plus Maze
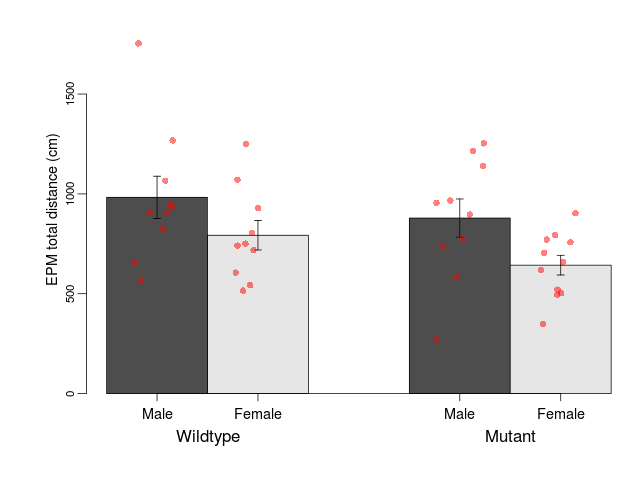
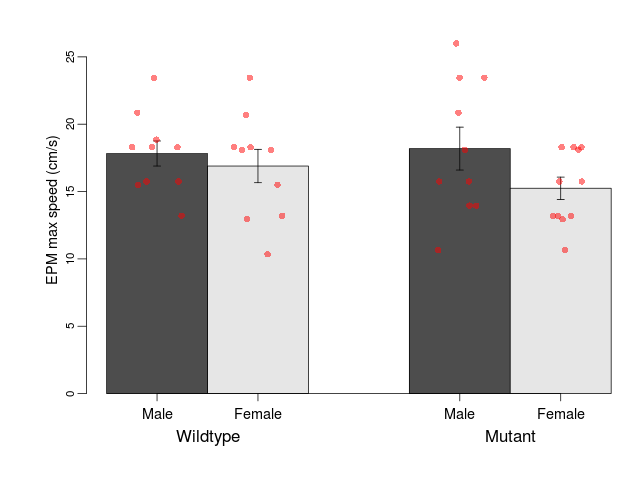
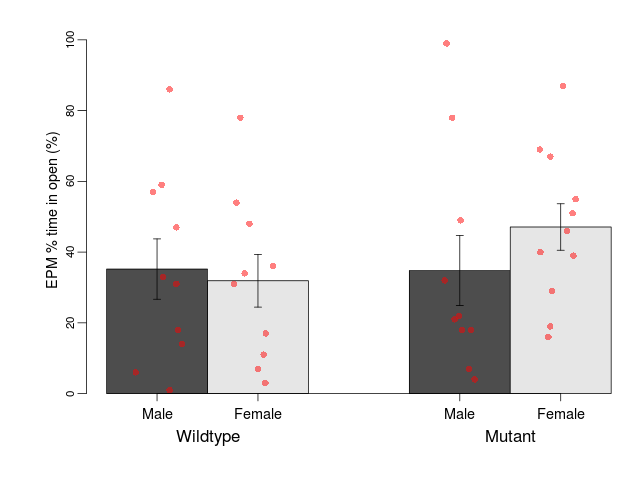
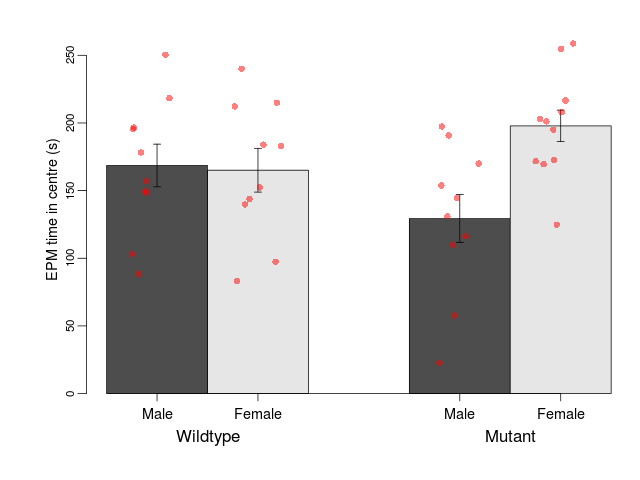
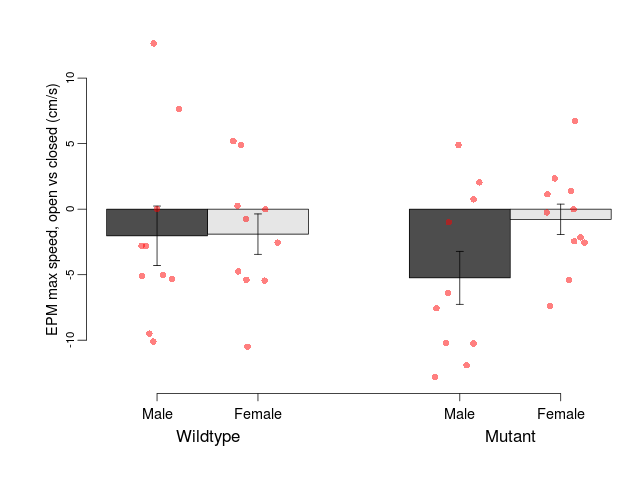
Variables shown are: EPM total distance, Total distance (cm) travelled in any arm or central zone of the EPM. EPM max speed, Maximum speed (cm/s) travelled in any arm or central zone of the EPM. EPM % time in open, Percentage of time in the open or closed arms of the EPM spent in open arms. EPM time in centre, Total time (s) spent in the central zone of the EPM. EPM max speed, open vs closed, Difference between the maximum speed (cm/s) observed in the open arms and the closed arms of the EPM.
| Variable | Units | Wildtype M (n=10) | Wildtype F (n=10) | Mutant M (n=10) | Mutant F (n=11) | P(sex×mutation) | P(mutation) |
|---|---|---|---|---|---|---|---|
| EPM total distance | cm | 983 (106) | 793 (74) | 879 (96) | 643 (49) | 0.78 | 0.13 |
| EPM max speed | cm/s | 17.8 (0.9) | 16.9 (1.2) | 18.2 (1.6) | 15.2 (0.8) | 0.4 | 0.57 |
| EPM % time in open | % | 35.2 (8.5) | 31.9 (7.5) | 34.8 (9.9) | 47.1 (6.6) | 0.35 | 0.36 |
| EPM time in centre | s | 169 (16) | 165 (16) | 129 (18) | 198 (12) | 0.024 * | 0.88 |
| EPM max speed, open vs closed | cm/s | -2 (2.3) | -1.9 (1.5) | -5.2 (2) | -0.8 (1.2) | 0.23 | 0.58 |
Open Field/Novel Object
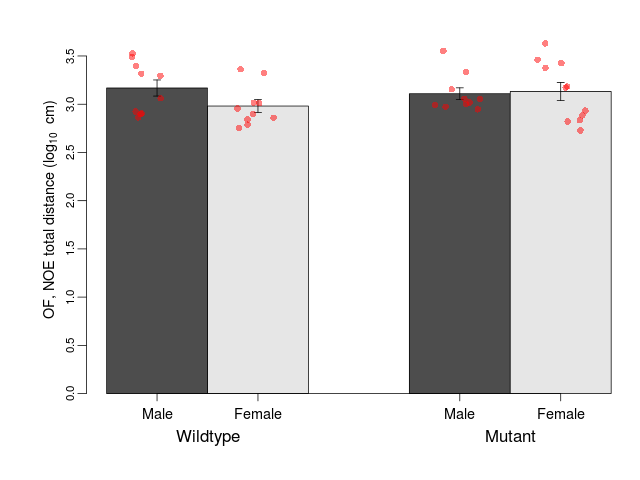
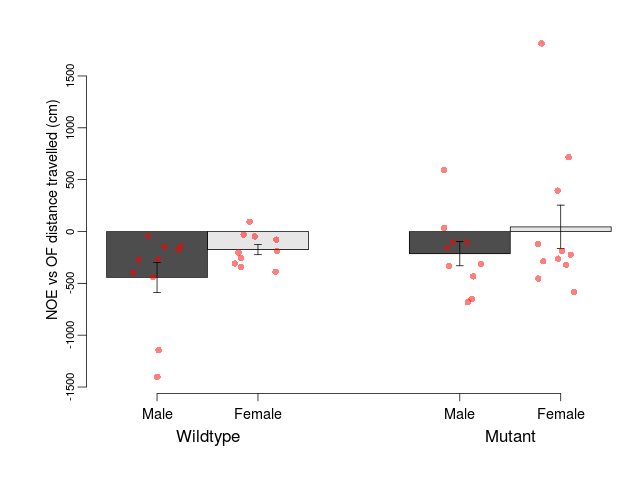
Variables shown are: OF, NOE total distance, Total distance travelled (log₁₀ cm) during initial exposure to the open field and in presence of the novel object. NOE vs OF distance travelled, Difference in distance travelled (cm) in presence of the novel object and during initial exposure to open field.
| Variable | Units | Wildtype M (n=10) | Wildtype F (n=10) | Mutant M (n=10) | Mutant F (n=11) | P(sex×mutation) | P(mutation) |
|---|---|---|---|---|---|---|---|
| OF, NOE total distance | log10 cm | 3.17 (0.08) | 2.98 (0.07) | 3.11 (0.06) | 3.13 (0.09) | 0.19 | 0.54 |
| NOE vs OF distance travelled | cm | -443 (145) | -175 (49) | -214 (117) | 44 (210) | 0.97 | 0.14 |
Rotarod
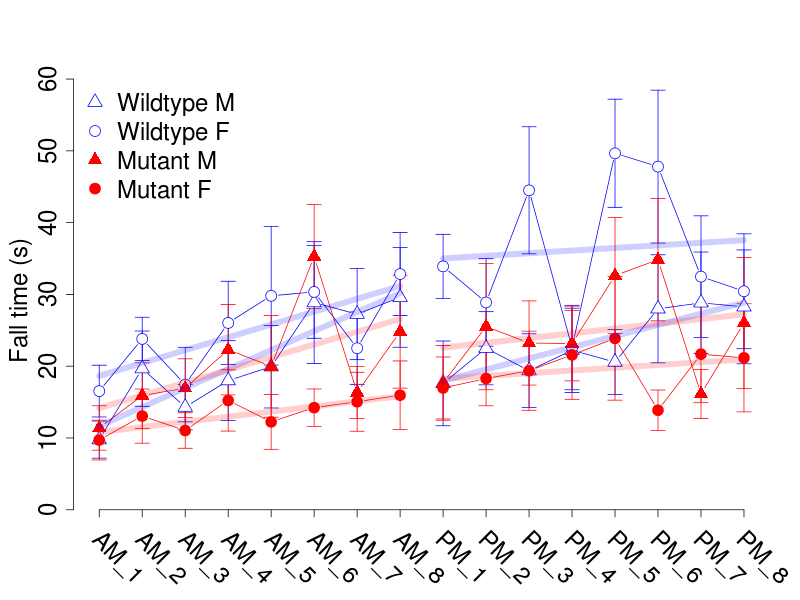
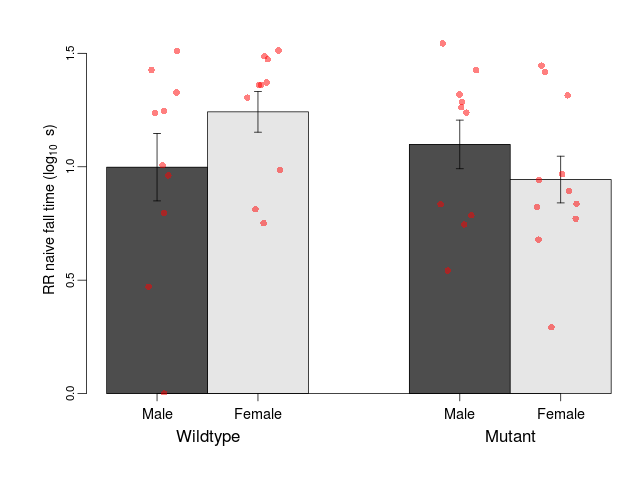
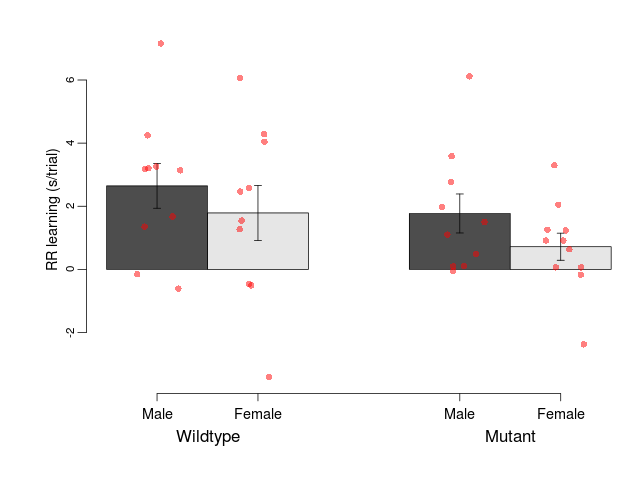
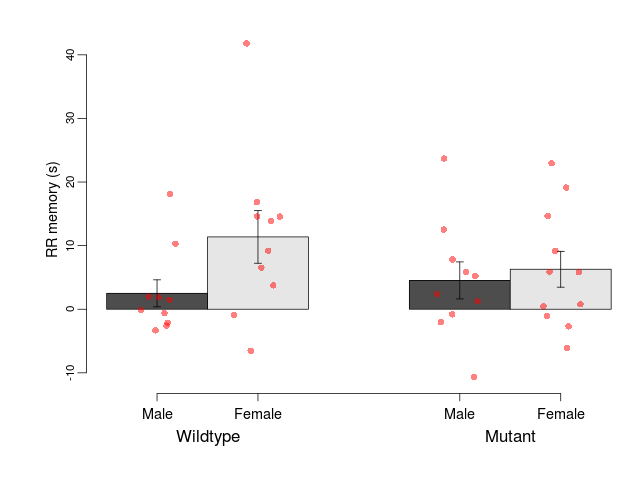
Variables shown are: RR naive fall time, Fall time on accelerating rotarod (log₁₀ s), naive performance in session 1. RR learning, Learning on rotarod, measured as increase in fall time per trial (s/trial) in session 1. RR memory, Memory on rotarod, measured as excess fall time at middle of session 2 relative to middle of session 1.
| Variable | Units | Wildtype M (n=10) | Wildtype F (n=10) | Mutant M (n=10) | Mutant F (n=11) | P(sex×mutation) | P(mutation) |
|---|---|---|---|---|---|---|---|
| RR naive fall time | log10 s | 1 (0.15) | 1.24 (0.09) | 1.1 (0.11) | 0.94 (0.1) | 0.088 | 0.37 |
| RR learning | s/trial | 2.6 (0.7) | 1.8 (0.9) | 1.8 (0.6) | 0.7 (0.4) | 0.88 | 0.15 |
| RR memory | s | 2.5 (2.1) | 11.4 (4.1) | 4.5 (2.9) | 6.3 (2.8) | 0.25 | 0.6 |
Fear Conditioning
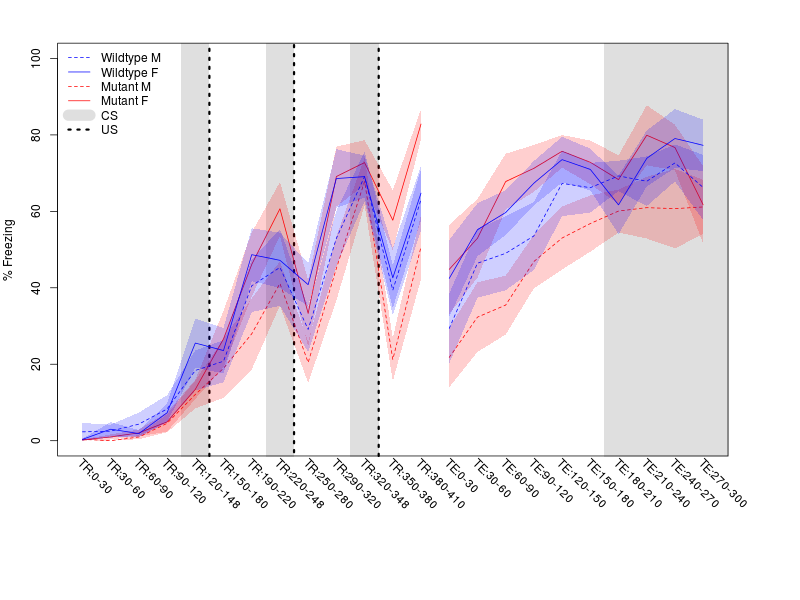
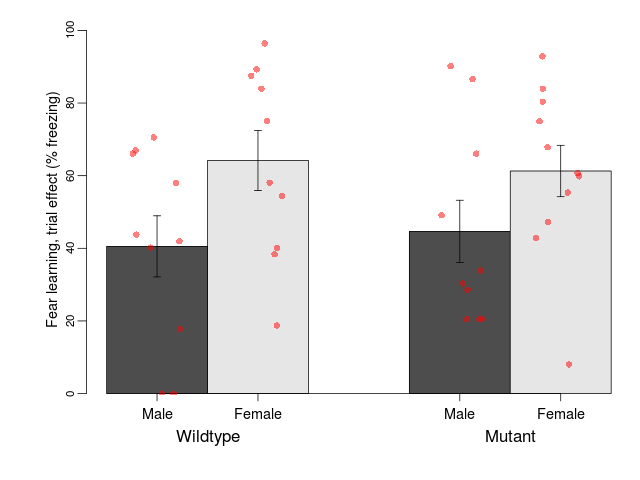
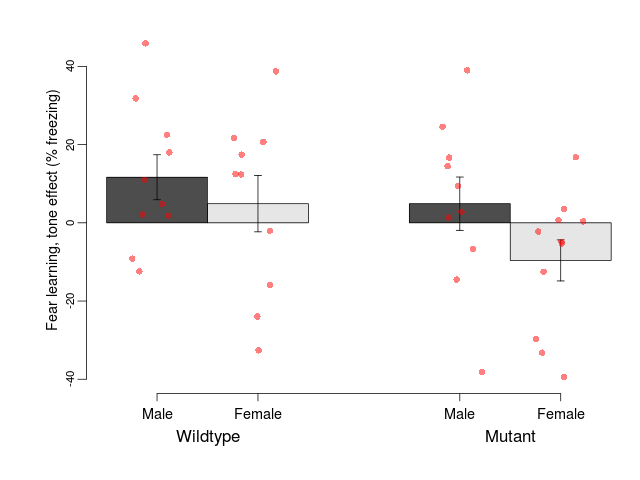
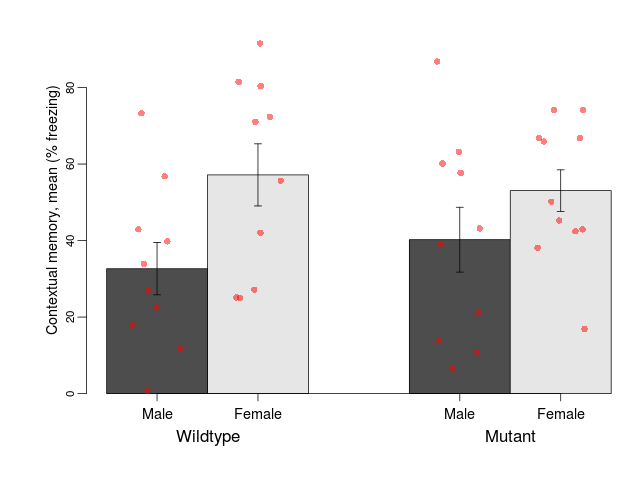
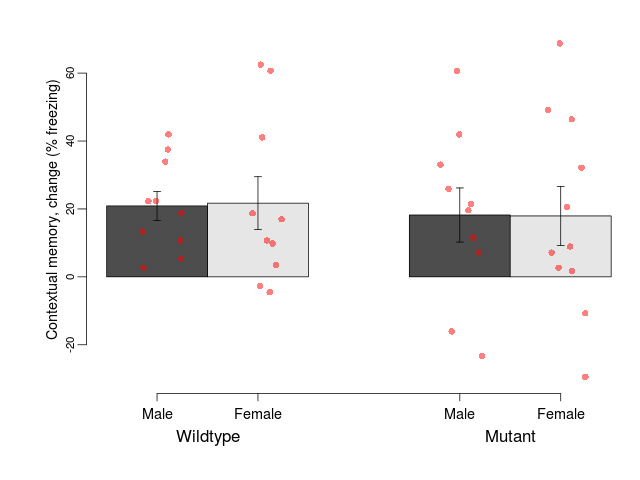
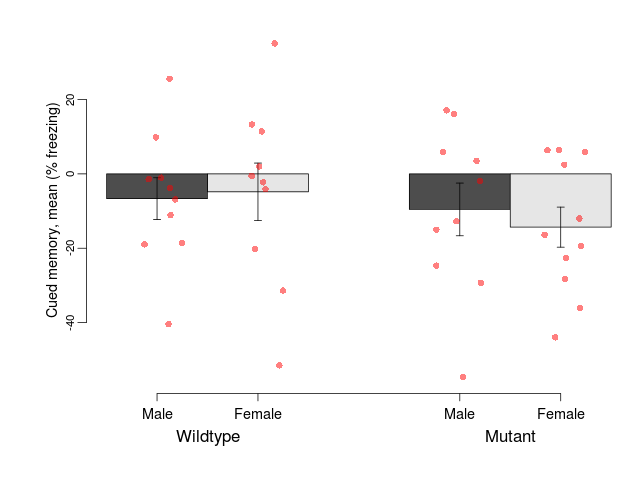
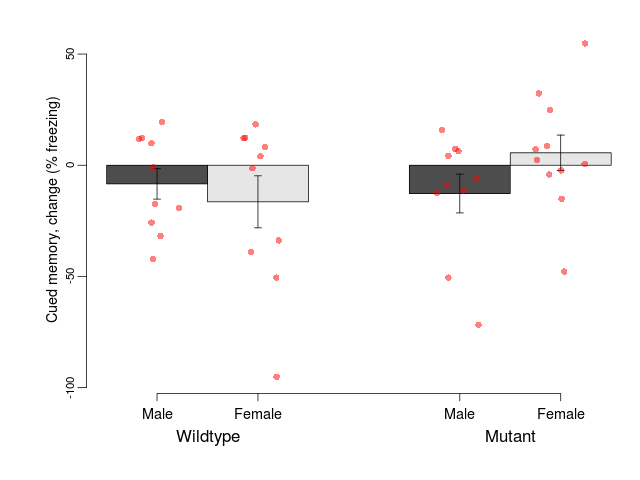
Variables shown are: Fear learning, trial effect, Fear learning, measured as extra % time freezing before third trial compared to % time freezing before first trial. Fear learning, tone effect, Fear learning, measured as increase in % time freezing due to third tone compared to increase in % time freezing due to first tone. Contextual memory, mean, Contextual memory, measured as difference in % time freezing during first 120 s re-exposure to the box compared to first 120 s in the box on previous day. Contextual memory, change, Contextual memory, measured as increase in % time spent freezing from first time bin of 30 s to fourth bin of 30 s during 120 s re-exposure to the box. Cued memory, mean, Cued memory, measured as increase in % time spent freezing during 120 s of tone re-exposure compared to increase in % time spent freezing during initial tone on previous day. Cued memory, change, Cued memory, measured as increase in % time spent freezing from first time bin of 30 s to fourth bin of 30 s during 120 s re-exposure to the tone.
| Variable | Units | Wildtype M (n=10) | Wildtype F (n=10) | Mutant M (n=10) | Mutant F (n=11) | P(sex×mutation) | P(mutation) |
|---|---|---|---|---|---|---|---|
| Fear learning, trial effect | % freezing | 40.5 (8.4) | 64.2 (8.3) | 44.6 (8.6) | 61.3 (7.1) | 0.67 | 0.95 |
| Fear learning, tone effect | % freezing | 11.6 (5.8) | 4.9 (7.2) | 4.9 (6.8) | -9.6 (5.2) | 0.54 | 0.095 |
| Contextual memory, mean | % freezing | 32.6 (6.8) | 57.2 (8.1) | 40.2 (8.5) | 53.1 (5.4) | 0.42 | 0.83 |
| Contextual memory, change | % freezing | 20.9 (4.3) | 21.7 (7.8) | 18.2 (8) | 17.9 (8.7) | 0.94 | 0.67 |
| Cued memory, mean | % freezing | -6.7 (5.6) | -4.8 (7.7) | -9.6 (7.1) | -14.3 (5.4) | 0.61 | 0.34 |
| Cued memory, change | % freezing | -8.4 (6.8) | -16.5 (11.7) | -12.7 (8.7) | 5.6 (8) | 0.15 | 0.31 |
- Overview
- Basal Synaptic Transmission
- Paired Pulse Facilitation
- Theta Burst Stimulation
- Long Term Potentiation
Overview
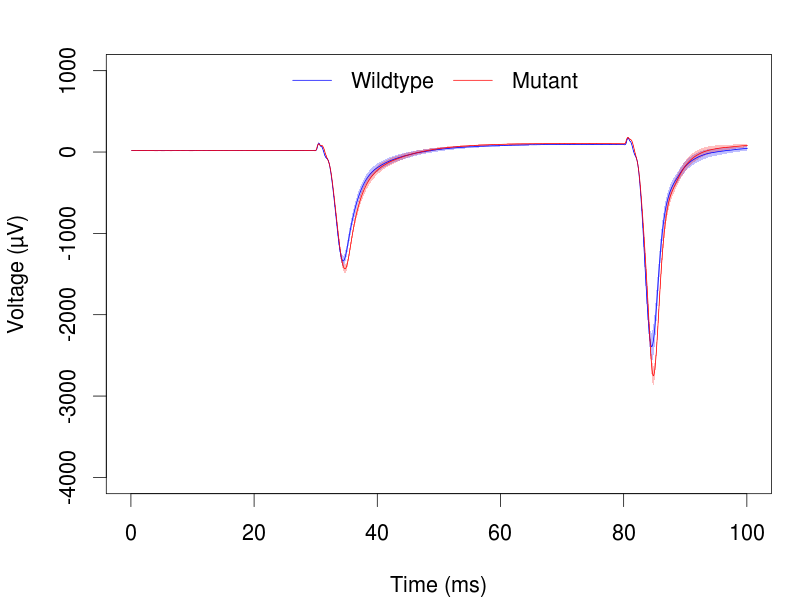
Mutant slices showed little overall electrophysiological difference from wildtype slices, with no electrophysiological variables significantly affected by this mutation. Note that in the theta burst analysis, the tenth burst is analysed as representative of individual burst amplitude.
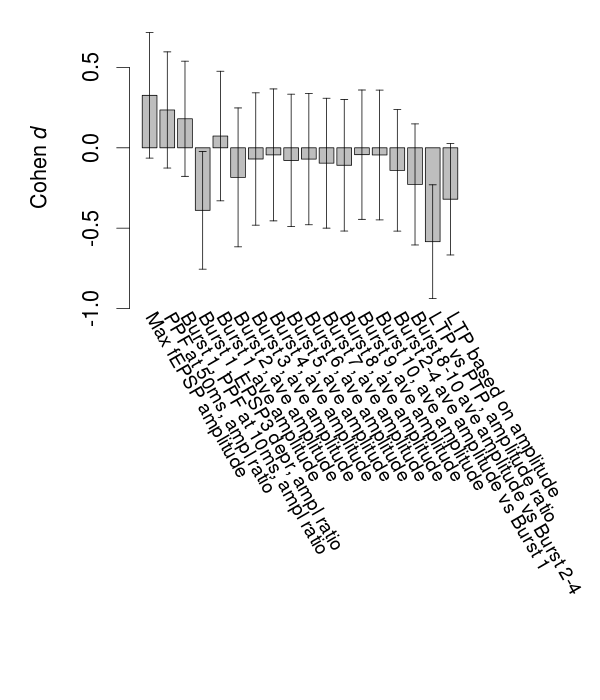
Variables shown are: Max fEPSP amplitude, Maximum field excitatory postsynaptic potential (fEPSP) amplitude. PPF at 50ms, ampl ratio, Paired pulse facilitation (PPF), pulses separated by 50ms, amplitude ratio. Burst 1, PPF at 10ms, ampl ratio, Paired pulse facilitation (PPF), pulses separated by 10ms, amplitude ratio, observed during first two pulses of the first 100Hz burst during theta-burst stimulation. Burst 1, EPSP3 depr, ampl ratio, Depression observed in third fEPSP relative to the second fEPSP of the first 100Hz burst, amplitude ratio. Burst 1, ave amplitude, Average amplitude of four fEPSPs in first burst. Burst 2, ave amplitude, Average amplitude of four fEPSPs in second burst. Burst 3, ave amplitude, Average amplitude of four fEPSPs in third burst. Burst 4, ave amplitude, Average amplitude of four fEPSPs in fourth burst. Burst 5, ave amplitude, Average amplitude of four fEPSPs in fifth burst. Burst 6, ave amplitude, Average amplitude of four fEPSPs in sixth burst. Burst 7, ave amplitude, Average amplitude of four fEPSPs in seventh burst. Burst 8, ave amplitude, Average amplitude of four fEPSPs in eighth burst. Burst 9, ave amplitude, Average amplitude of four fEPSPs in ninth burst. Burst 10, ave amplitude, Average amplitude of four fEPSPs in tenth burst. Burst 2-4 ave amplitude vs Burst 1, Facilitation observed in average amplitude of bursts 2-4, relative to average amplitude of burst 1. Burst 8-10 ave amplitude vs Burst 2-4, Depression observed in average amplitude of bursts 8-10, relative to average amplitude of bursts 2-4. LTP vs PTP, amplitude ratio, Reduction in potentiation from immediately after theta-burst stimulation to one hour later, fEPSP amplitude ratio. LTP based on amplitude, Long term potentiation, ratio of amplitudes of fEPSPs in test pathway and control pathway.
| Variable | Units | Wildtype slices (animals) | Wildtype mean (SEM) | Mutant slices (animals) | Mutant mean (SEM) | P(animals) | P(mutation) |
|---|---|---|---|---|---|---|---|
| Max fEPSP amplitude | µV | 18 (5) | 2840 (180) | 24 (7) | 3080 (150) | 0.37 | 0.34 |
| PPF at 50ms, ampl ratio | % | 18 (5) | 170.5 (5) | 24 (7) | 175.7 (4.7) | 0.94 | 0.28 |
| Burst 1, PPF at 10ms, ampl ratio | % | 17 (5) | 173.3 (10.8) | 24 (7) | 179.9 (6.1) | 0.54 | 0.56 |
| Burst 1, EPSP3 depr, ampl ratio | % | 17 (5) | 64.5 (3.3) | 24 (7) | 59.6 (2.4) | 0.32 | 0.28 |
| Burst 1, ave amplitude | µV | 17 (5) | 1304 (74) | 24 (7) | 1323 (44) | 0.062 | 0.86 |
| Burst 2, ave amplitude | µV | 17 (5) | 2100 (210) | 24 (7) | 1977 (98) | 0.086 | 0.65 |
| Burst 3, ave amplitude | µV | 17 (5) | 2330 (220) | 24 (7) | 2270 (110) | 0.12 | 0.86 |
| Burst 4, ave amplitude | µV | 17 (5) | 2440 (210) | 24 (7) | 2400 (120) | 0.14 | 0.91 |
| Burst 5, ave amplitude | µV | 17 (5) | 2430 (200) | 24 (7) | 2380 (110) | 0.15 | 0.84 |
| Burst 6, ave amplitude | µV | 17 (5) | 2350 (180) | 24 (7) | 2310 (100) | 0.17 | 0.85 |
| Burst 7, ave amplitude | µV | 17 (5) | 2266 (174) | 24 (7) | 2210 (97) | 0.16 | 0.8 |
| Burst 8, ave amplitude | µV | 17 (5) | 2174 (163) | 24 (7) | 2114 (92) | 0.2 | 0.77 |
| Burst 9, ave amplitude | µV | 17 (5) | 2095 (159) | 23 (7) | 2073 (86) | 0.085 | 0.92 |
| Burst 10, ave amplitude | µV | 17 (5) | 2028 (154) | 23 (7) | 2005 (86) | 0.089 | 0.91 |
| Burst 2-4 ave amplitude vs Burst 1 | % | 17 (5) | 173.9 (6.5) | 24 (7) | 170 (5.8) | 0.52 | 0.66 |
| Burst 8-10 ave amplitude vs Burst 2-4 | % | 17 (5) | 92.9 (1.7) | 23 (7) | 91.5 (1.1) | 0.06 | 0.59 |
| LTP vs PTP, amplitude ratio | % | 17 (5) | 82.6 (1.5) | 24 (7) | 78.8 (1.4) | 0.37 | 0.11 |
| LTP based on amplitude | % | 17 (5) | 179.8 (7.4) | 24 (7) | 170.5 (5.7) | 0.83 | 0.23 |
Basal Synaptic Transmission
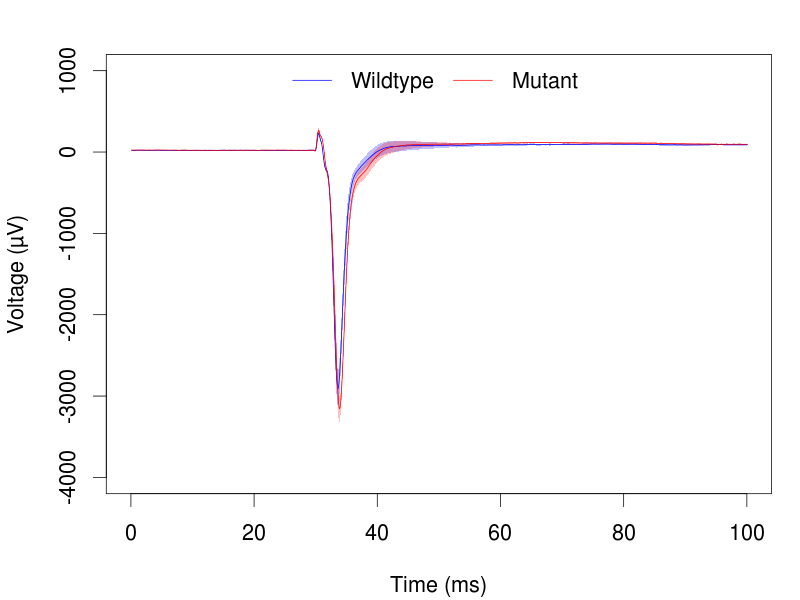
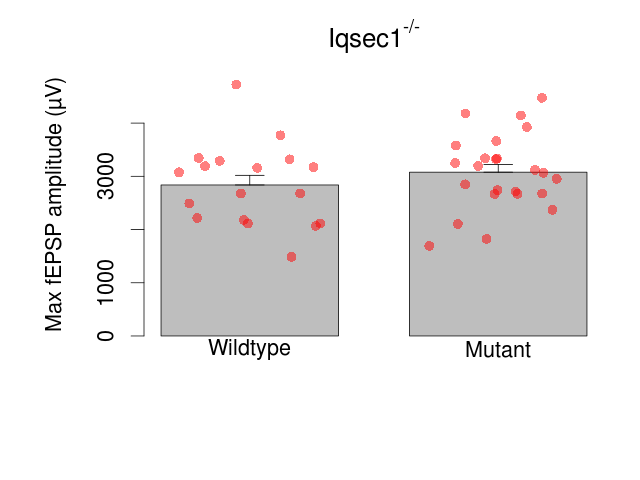
Variables shown are: Max fEPSP amplitude, Maximum field excitatory postsynaptic potential (fEPSP) amplitude.
| Variable | Units | Wildtype slices (animals) | Wildtype mean (SEM) | Mutant slices (animals) | Mutant mean (SEM) | P(animals) | P(mutation) |
|---|---|---|---|---|---|---|---|
| Max fEPSP amplitude | µV | 18 (5) | 2840 (180) | 24 (7) | 3080 (150) | 0.37 | 0.34 |
Paired Pulse Facilitation
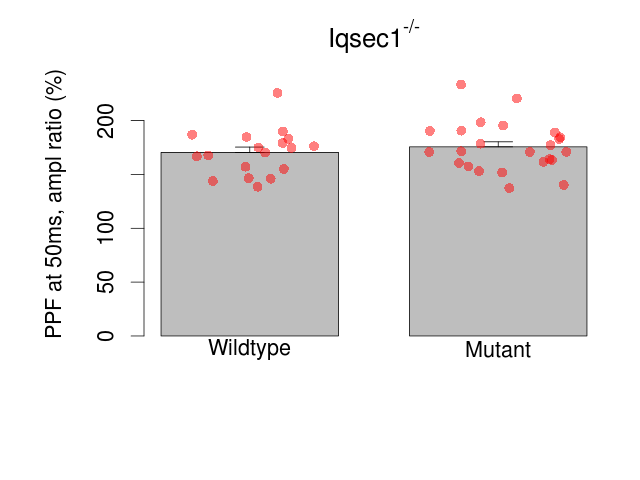
Variables shown are: PPF at 50ms, ampl ratio, Paired pulse facilitation (PPF), pulses separated by 50ms, amplitude ratio.
| Variable | Units | Wildtype slices (animals) | Wildtype mean (SEM) | Mutant slices (animals) | Mutant mean (SEM) | P(animals) | P(mutation) |
|---|---|---|---|---|---|---|---|
| PPF at 50ms, ampl ratio | % | 18 (5) | 170.5 (5) | 24 (7) | 175.7 (4.7) | 0.94 | 0.28 |
Theta Burst Stimulation
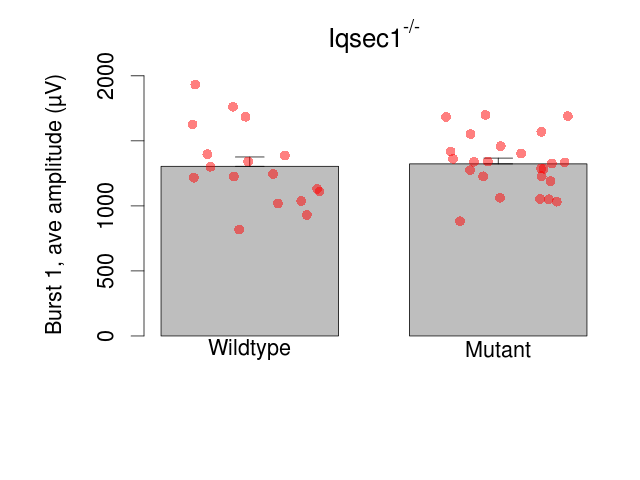
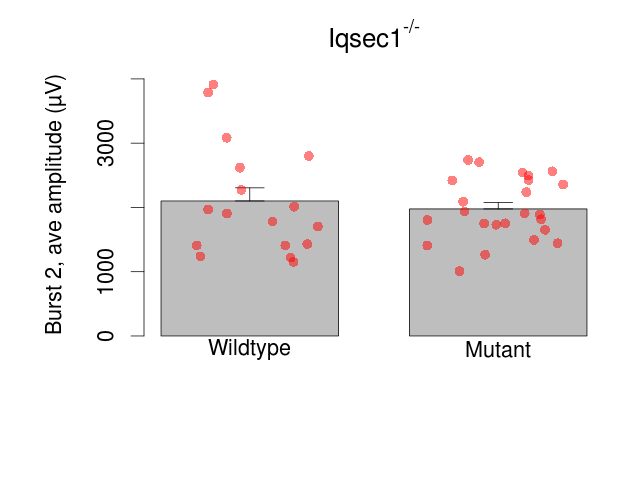
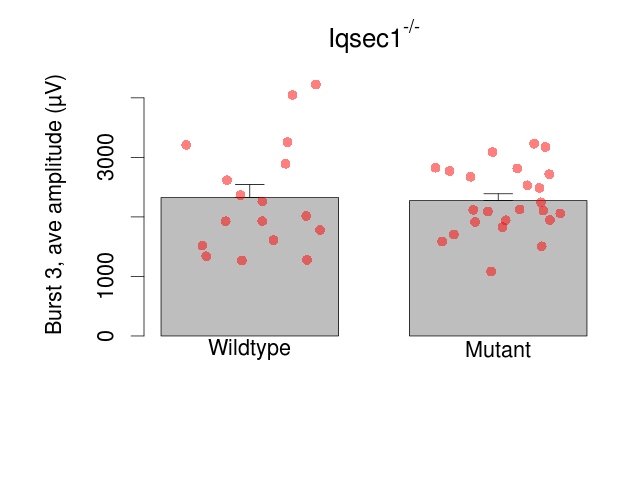
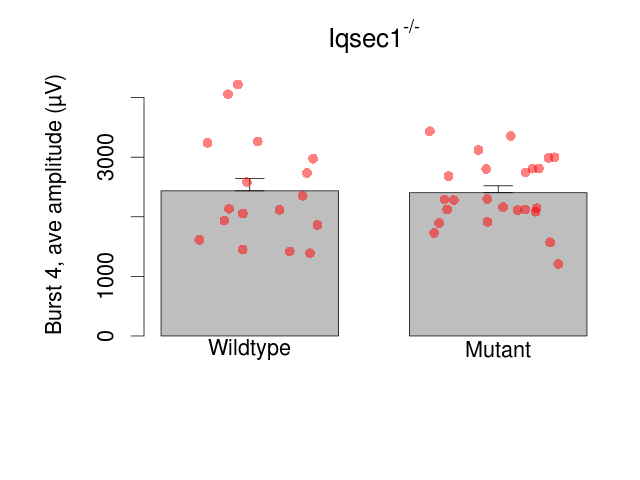
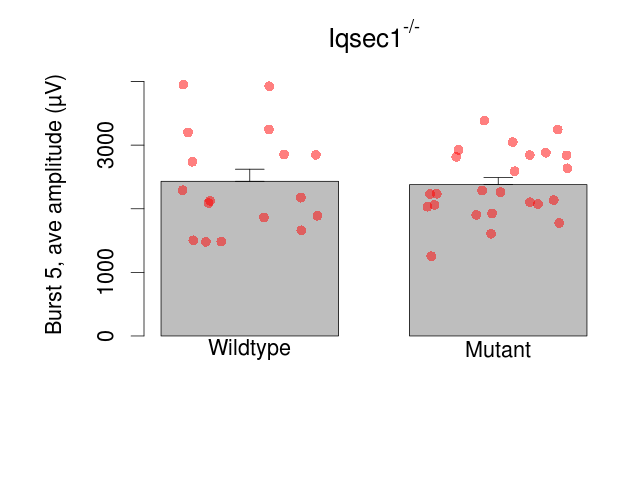
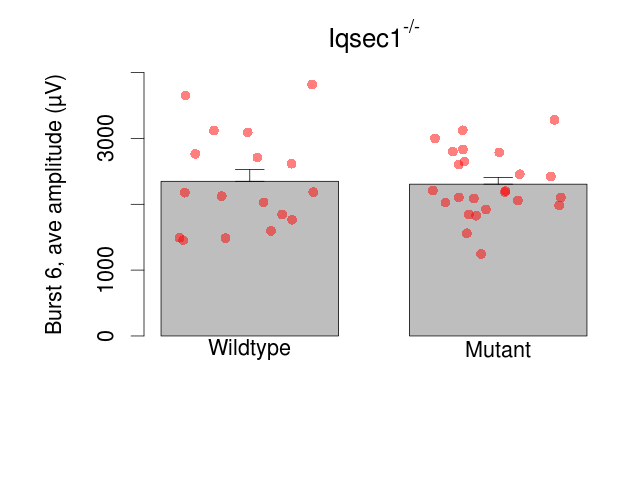
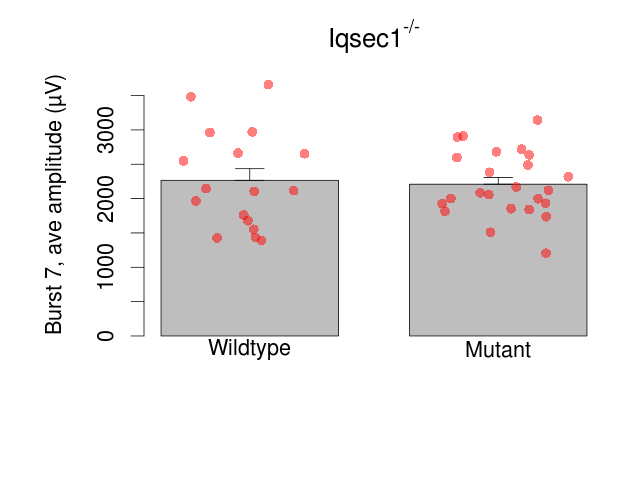
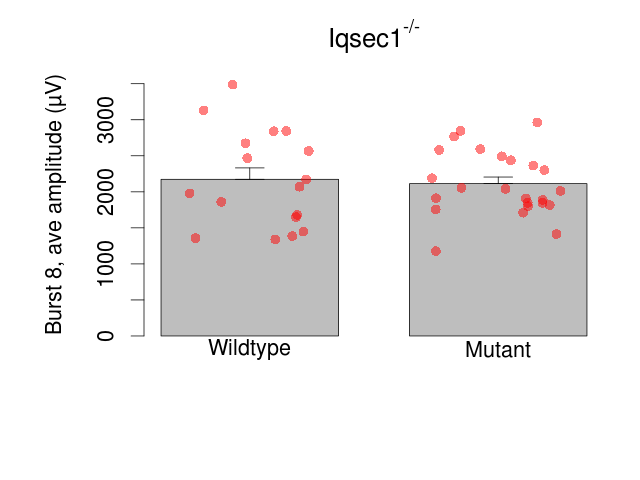
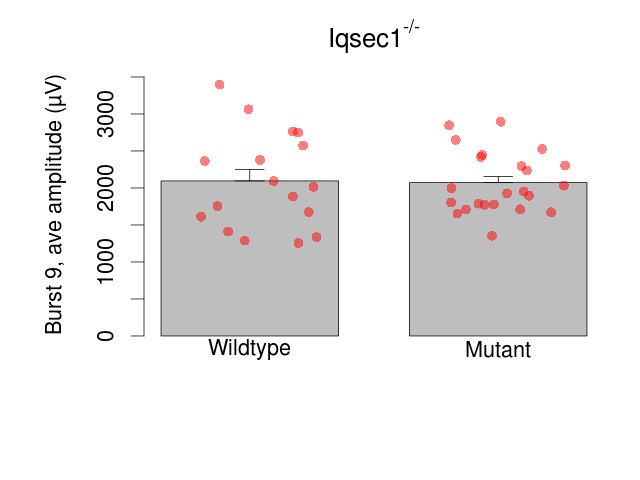
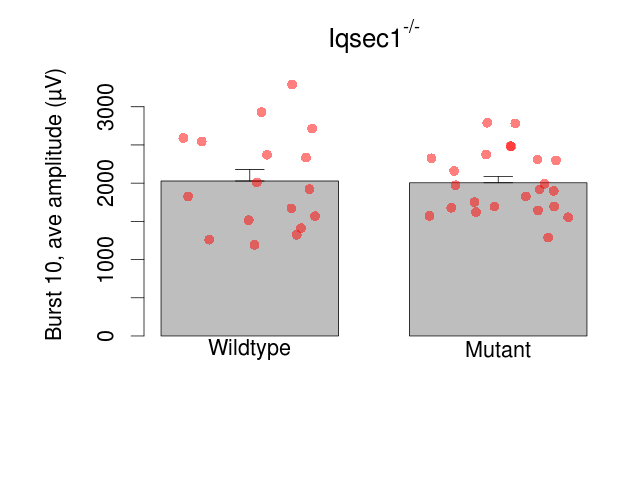
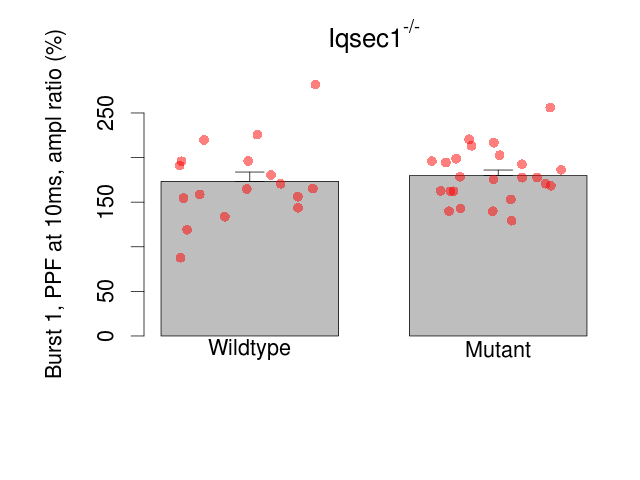
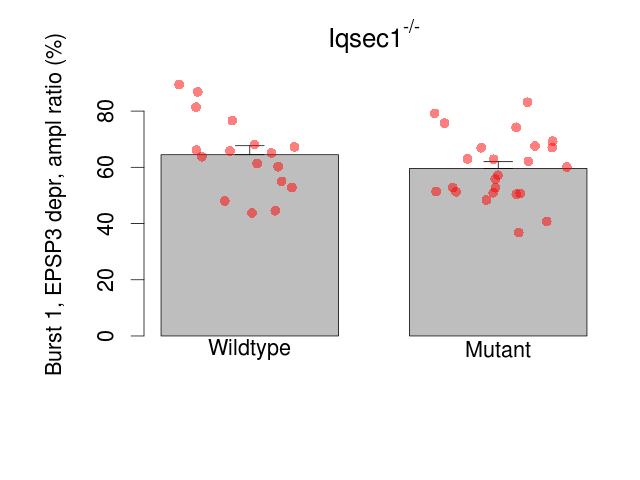
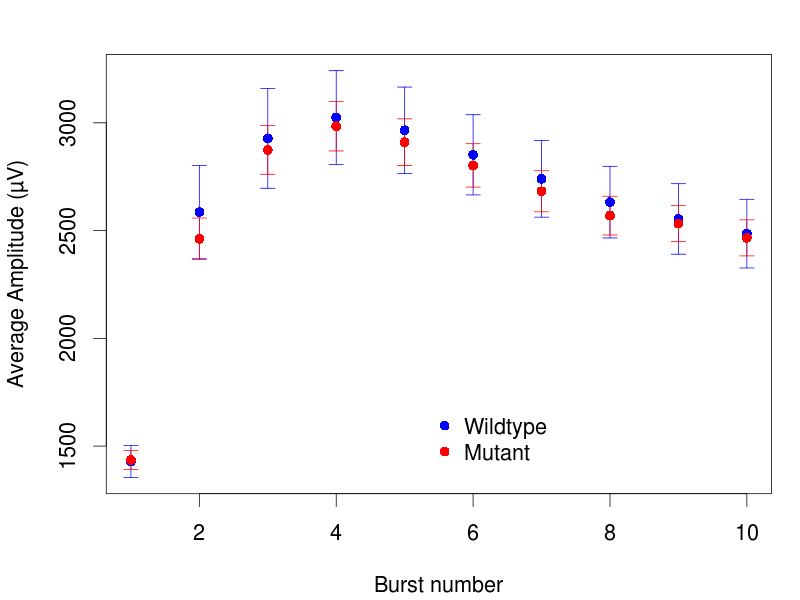
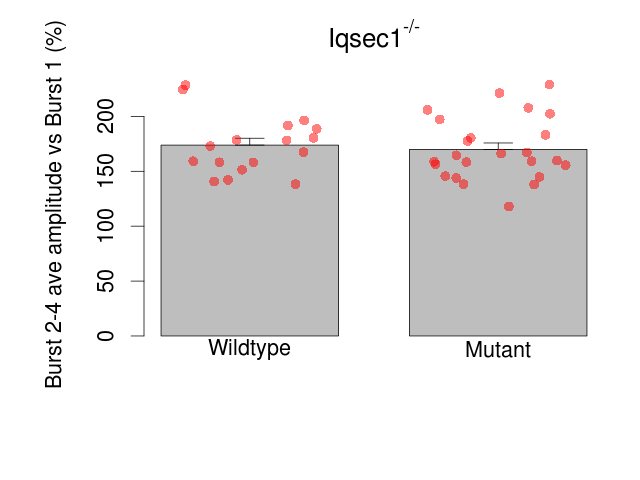
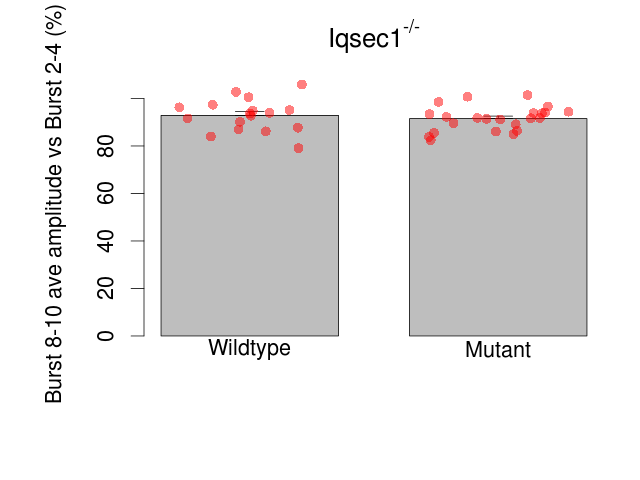
Variables shown are: Burst 1, PPF at 10ms, ampl ratio, Paired pulse facilitation (PPF), pulses separated by 10ms, amplitude ratio, observed during first two pulses of the first 100Hz burst during theta-burst stimulation. Burst 1, EPSP3 depr, ampl ratio, Depression observed in third fEPSP relative to the second fEPSP of the first 100Hz burst, amplitude ratio. Burst 1, ave amplitude, Average amplitude of four fEPSPs in first burst. Burst 2, ave amplitude, Average amplitude of four fEPSPs in second burst. Burst 3, ave amplitude, Average amplitude of four fEPSPs in third burst. Burst 4, ave amplitude, Average amplitude of four fEPSPs in fourth burst. Burst 5, ave amplitude, Average amplitude of four fEPSPs in fifth burst. Burst 6, ave amplitude, Average amplitude of four fEPSPs in sixth burst. Burst 7, ave amplitude, Average amplitude of four fEPSPs in seventh burst. Burst 8, ave amplitude, Average amplitude of four fEPSPs in eighth burst. Burst 9, ave amplitude, Average amplitude of four fEPSPs in ninth burst. Burst 10, ave amplitude, Average amplitude of four fEPSPs in tenth burst. Burst 2-4 ave amplitude vs Burst 1, Facilitation observed in average amplitude of bursts 2-4, relative to average amplitude of burst 1. Burst 8-10 ave amplitude vs Burst 2-4, Depression observed in average amplitude of bursts 8-10, relative to average amplitude of bursts 2-4.
| Variable | Units | Wildtype slices (animals) | Wildtype mean (SEM) | Mutant slices (animals) | Mutant mean (SEM) | P(animals) | P(mutation) |
|---|---|---|---|---|---|---|---|
| Burst 1, PPF at 10ms, ampl ratio | % | 17 (5) | 173.3 (10.8) | 24 (7) | 179.9 (6.1) | 0.54 | 0.56 |
| Burst 1, EPSP3 depr, ampl ratio | % | 17 (5) | 64.5 (3.3) | 24 (7) | 59.6 (2.4) | 0.32 | 0.28 |
| Burst 1, ave amplitude | µV | 17 (5) | 1304 (74) | 24 (7) | 1323 (44) | 0.062 | 0.86 |
| Burst 2, ave amplitude | µV | 17 (5) | 2100 (210) | 24 (7) | 1977 (98) | 0.086 | 0.65 |
| Burst 3, ave amplitude | µV | 17 (5) | 2330 (220) | 24 (7) | 2270 (110) | 0.12 | 0.86 |
| Burst 4, ave amplitude | µV | 17 (5) | 2440 (210) | 24 (7) | 2400 (120) | 0.14 | 0.91 |
| Burst 5, ave amplitude | µV | 17 (5) | 2430 (200) | 24 (7) | 2380 (110) | 0.15 | 0.84 |
| Burst 6, ave amplitude | µV | 17 (5) | 2350 (180) | 24 (7) | 2310 (100) | 0.17 | 0.85 |
| Burst 7, ave amplitude | µV | 17 (5) | 2266 (174) | 24 (7) | 2210 (97) | 0.16 | 0.8 |
| Burst 8, ave amplitude | µV | 17 (5) | 2174 (163) | 24 (7) | 2114 (92) | 0.2 | 0.77 |
| Burst 9, ave amplitude | µV | 17 (5) | 2095 (159) | 23 (7) | 2073 (86) | 0.085 | 0.92 |
| Burst 10, ave amplitude | µV | 17 (5) | 2028 (154) | 23 (7) | 2005 (86) | 0.089 | 0.91 |
| Burst 2-4 ave amplitude vs Burst 1 | % | 17 (5) | 173.9 (6.5) | 24 (7) | 170 (5.8) | 0.52 | 0.66 |
| Burst 8-10 ave amplitude vs Burst 2-4 | % | 17 (5) | 92.9 (1.7) | 23 (7) | 91.5 (1.1) | 0.06 | 0.59 |
Long Term Potentiation
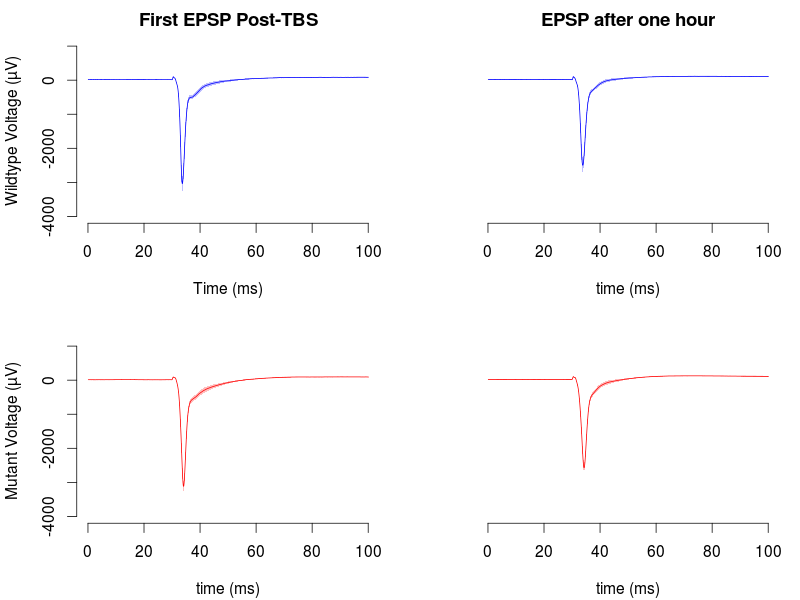
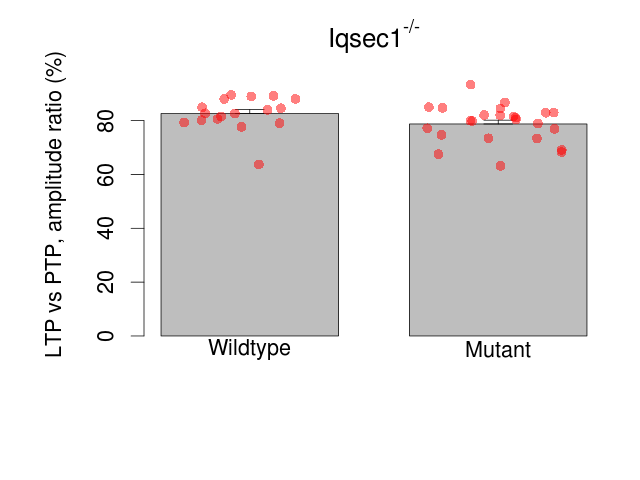
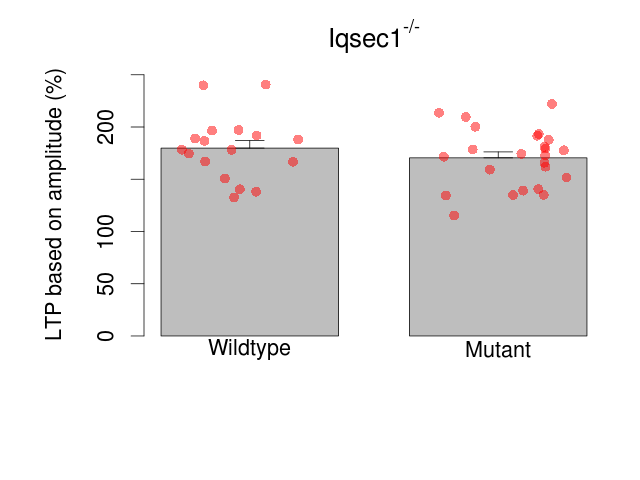
Variables shown are: LTP vs PTP, amplitude ratio, Reduction in potentiation from immediately after theta-burst stimulation to one hour later, fEPSP amplitude ratio. LTP based on amplitude, Long term potentiation, ratio of amplitudes of fEPSPs in test pathway and control pathway.
| Variable | Units | Wildtype slices (animals) | Wildtype mean (SEM) | Mutant slices (animals) | Mutant mean (SEM) | P(animals) | P(mutation) |
|---|---|---|---|---|---|---|---|
| LTP vs PTP, amplitude ratio | % | 17 (5) | 82.6 (1.5) | 24 (7) | 78.8 (1.4) | 0.37 | 0.11 |
| LTP based on amplitude | % | 17 (5) | 179.8 (7.4) | 24 (7) | 170.5 (5.7) | 0.83 | 0.23 |
Behaviour raw data
| Animals | View |
| Elevated Plus Maze | View |
| Open Field | View |
| Novel Object Exploration | View |
| Rotarod | View |
Hippocampal slice electrophysiology raw data
| Animals and Brain slices | View |
| Field EPSP (Maximum) | View |
| Paired Pulse Facilitation | View |
| Long Term Potentiation | View |
| Data Files | View |