G2C::Genetics
NR2AdC+NR2BdC knock-out mouse
S.G.N. Grant and the G2C Consortium
Corresponding email: Seth.Grant@ed.ac.uk
G2CMine Data Warehouse
| Grin2a + Grin2b @ G2CMine |
Genetic and Genomic Information
| Gene symbol | Grin2a | Grin2b |
| MGI ID | MGI:95820 | MGI:95821 |
| G2Cdb mouse | G00000001 | G00000002 |
| Ensembl mouse | ENSMUSG00000059003 | ENSMUSG00000030209 |
| G2Cdb human | G00000026 | G00000027 |
| Ensembl human | ENSG00000183454 | ENSG00000150086 |
G2CMine Data Warehouse
G2CMine integrates the scientific findings of the Genes to Cognition Programme that utilised neuroproteomics, psychiatric genetics, high-throughput mouse gene targeting combined with behavioural and electrophysiological phenotyping and informatics in order to develop a general strategy for understanding cognition at the molecular, cellular and systems neuroscience levels.
G2CMine provides comprehensive Gene Ontology, Mammalian Phenotype Ontology, Human Phenotype Ontology, UniProt, genetic and protein interactions, and regional mouse brain expression results, together with the phenotyping results of the G2C Programme.
Mutation
This line harboured two mutations, a knockout of Grin2a and homozygous deletion of the c-terminal valine of Grin2b, derived from two G2C lines.Genotyping
Primers and other genotyping information can be obtained from each respective G2C line.Expression
Nothing available
Breeding
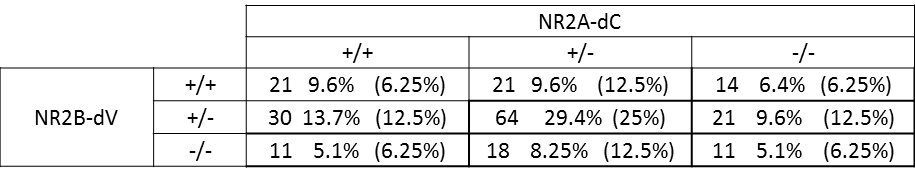
The compound mutant colony consisted of a point mutation in Grin2b (NR2B-dV) and c-terminal deletion in Grin2a (NR2A-dC). 274 pups were produced of which 211 (77.0%) survived to 3 weeks. The colony was maintained onto the C57BL/6J background. Genotypes of 3-week-old pups from NR2B-dV+/- x NR2A-dC+/- intercrosses identified the displayed frequencies, which conformed to Mendelian ratios (Χ2 test p = 0.11)
- Overview
- Basal Synaptic Transmission
- Paired Pulse Facilitation
- Theta Burst Stimulation
- Long Term Potentiation
Overview
Mutant slices showed medium overall electrophysiological difference from wildtype slices, with only one variable, LTP based on amplitude, significantly decreased in these mutant slices. Note that in the theta burst analysis, the tenth burst is analysed as representative of individual burst amplitude. Definitions of variables may be found below.
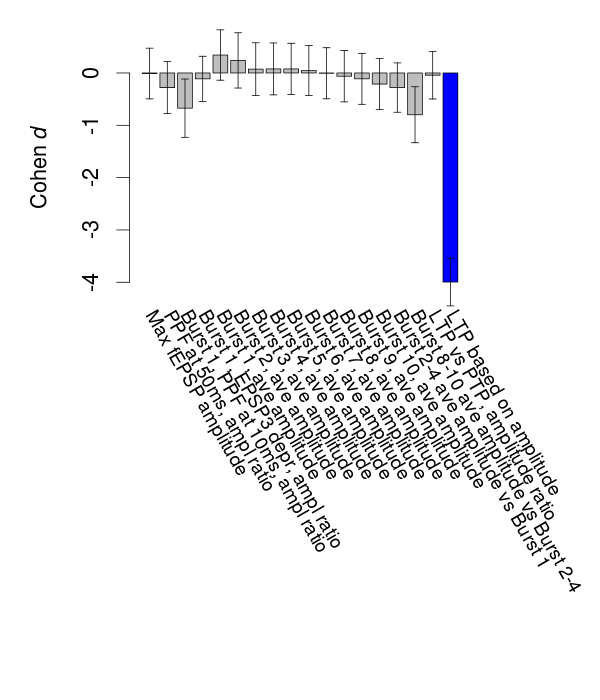
Variables shown are: Max fEPSP amplitude, Maximum field excitatory postsynaptic potential (fEPSP) amplitude. PPF at 50ms, ampl ratio, Paired pulse facilitation (PPF), pulses separated by 50ms, amplitude ratio. Burst 1, PPF at 10ms, ampl ratio, Paired pulse facilitation (PPF), pulses separated by 10ms, amplitude ratio, observed during first two pulses of the first 100Hz burst during theta-burst stimulation. Burst 1, EPSP3 depr, ampl ratio, Depression observed in third fEPSP relative to the second fEPSP of the first 100Hz burst, amplitude ratio. Burst 1, ave amplitude, Average amplitude of four fEPSPs in first burst. Burst 2, ave amplitude, Average amplitude of four fEPSPs in second burst. Burst 3, ave amplitude, Average amplitude of four fEPSPs in third burst. Burst 4, ave amplitude, Average amplitude of four fEPSPs in fourth burst. Burst 5, ave amplitude, Average amplitude of four fEPSPs in fifth burst. Burst 6, ave amplitude, Average amplitude of four fEPSPs in sixth burst. Burst 7, ave amplitude, Average amplitude of four fEPSPs in seventh burst. Burst 8, ave amplitude, Average amplitude of four fEPSPs in eighth burst. Burst 9, ave amplitude, Average amplitude of four fEPSPs in ninth burst. Burst 10, ave amplitude, Average amplitude of four fEPSPs in tenth burst. Burst 2-4 ave amplitude vs Burst 1, Facilitation observed in average amplitude of bursts 2-4, relative to average amplitude of burst 1. Burst 8-10 ave amplitude vs Burst 2-4, Depression observed in average amplitude of bursts 8-10, relative to average amplitude of bursts 2-4. LTP vs PTP, amplitude ratio, Reduction in potentiation from immediately after theta-burst stimulation to one hour later, fEPSP amplitude ratio. LTP based on amplitude, Long term potentiation, ratio of amplitudes of fEPSPs in test pathway and control pathway.
| Variable | Units | Wildtype slices (animals) | Wildtype mean (SEM) | Mutant slices (animals) | Mutant mean (SEM) | P(animals) | P(mutation) |
|---|---|---|---|---|---|---|---|
| Max fEPSP amplitude | µV | 16 (4) | 3100 (150) | 17 (4) | 3090 (170) | 0.43 | 0.98 |
| PPF at 50ms, ampl ratio | % | 16 (4) | 168.1 (4.4) | 17 (4) | 163.2 (4.4) | 0.051 | 0.59 |
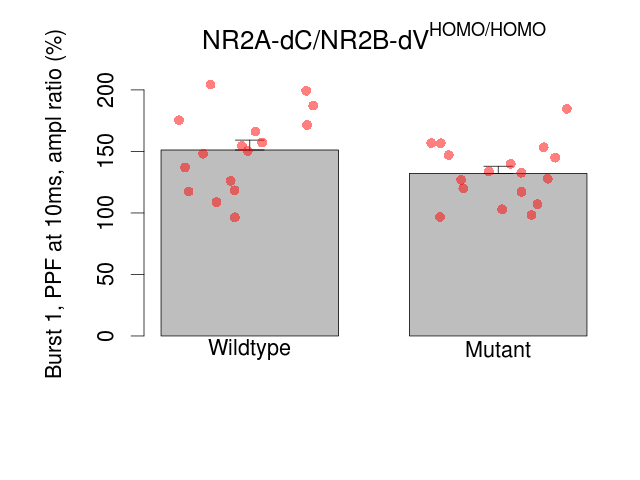
| Burst 1, PPF at 10ms, ampl ratio | % | 16 (4) | 151.2 (8.1) | 17 (4) | 132.2 (5.8) | 6e-04 *** | 0.32 |
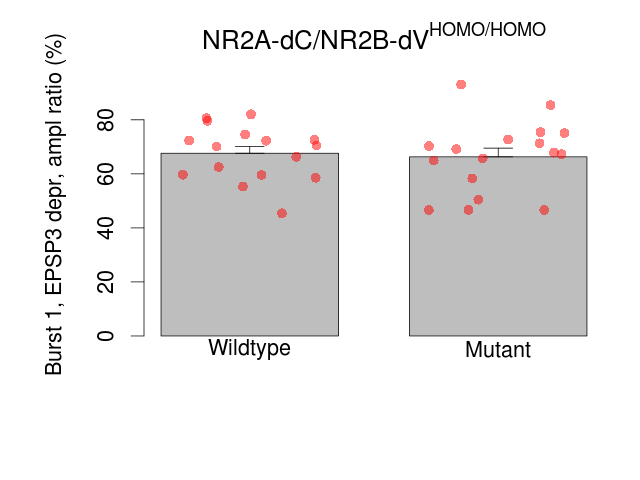
| Burst 1, EPSP3 depr, ampl ratio | % | 16 (4) | 67.6 (2.5) | 17 (4) | 66.3 (3.2) | 0.032 * | 0.83 |
| Burst 1, ave amplitude | µV | 16 (4) | 1401 (64) | 17 (4) | 1507 (86) | 0.054 | 0.51 |
| Burst 2, ave amplitude | µV | 16 (4) | 2250 (130) | 17 (4) | 2370 (130) | 0.35 | 0.55 |
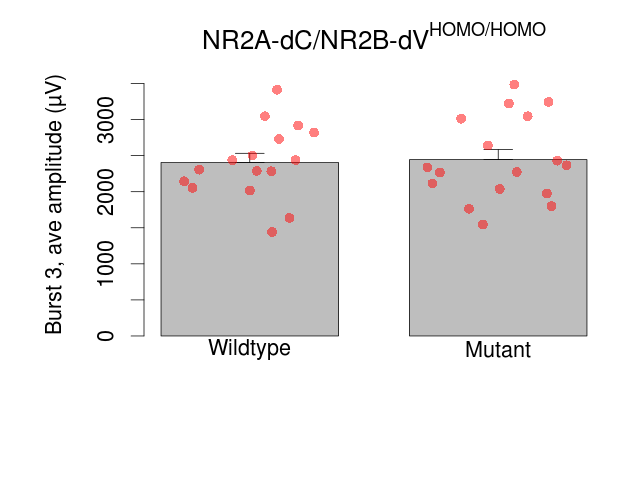
| Burst 3, ave amplitude | µV | 16 (4) | 2410 (130) | 17 (4) | 2450 (140) | 0.49 | 0.84 |
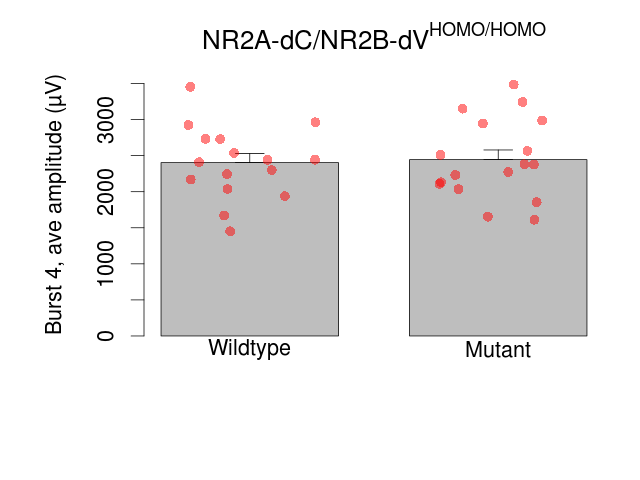
| Burst 4, ave amplitude | µV | 16 (4) | 2400 (130) | 17 (4) | 2440 (130) | 0.66 | 0.8 |
| Burst 5, ave amplitude | µV | 16 (4) | 2350 (120) | 17 (4) | 2390 (130) | 0.75 | 0.78 |
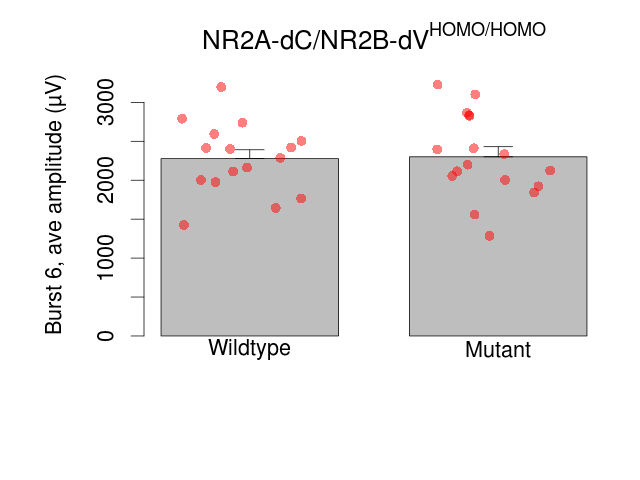
| Burst 6, ave amplitude | µV | 16 (4) | 2280 (110) | 17 (4) | 2300 (130) | 0.8 | 0.86 |
| Burst 7, ave amplitude | µV | 16 (4) | 2200 (110) | 17 (4) | 2200 (130) | 0.81 | 0.98 |
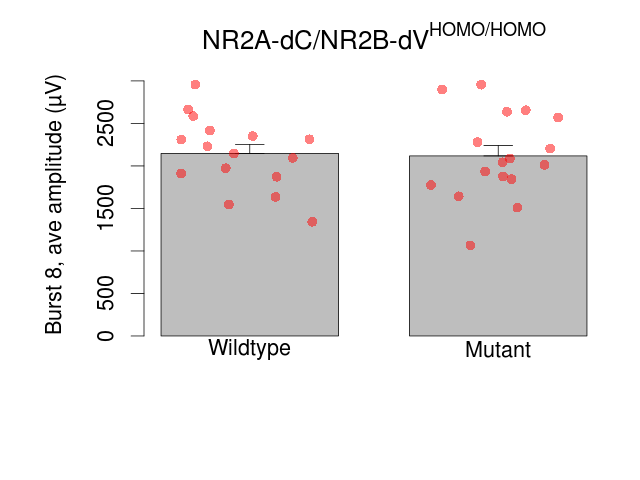
| Burst 8, ave amplitude | µV | 16 (4) | 2150 (110) | 17 (4) | 2120 (120) | 0.86 | 0.8 |
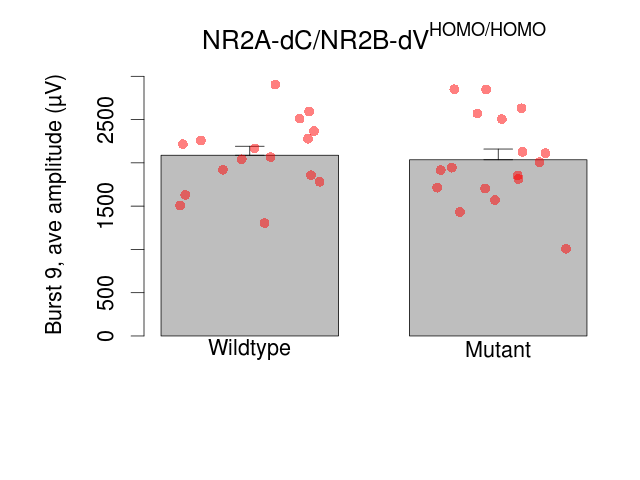
| Burst 9, ave amplitude | µV | 16 (4) | 2090 (100) | 17 (4) | 2040 (120) | 0.86 | 0.65 |
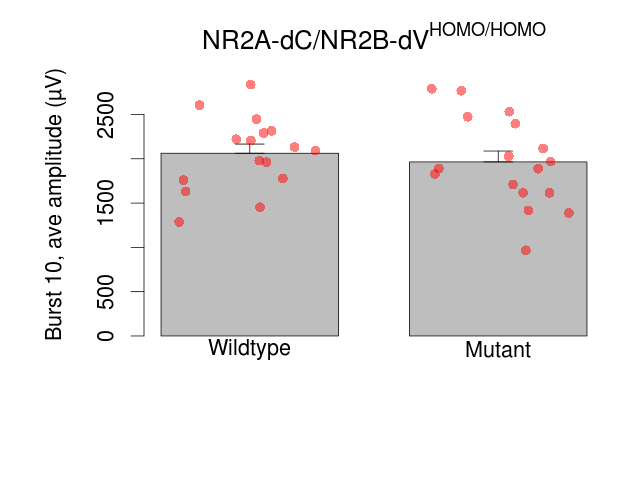
| Burst 10, ave amplitude | µV | 16 (4) | 2060 (100) | 17 (4) | 1960 (120) | 0.87 | 0.39 |
| Burst 2-4 ave amplitude vs Burst 1 | % | 16 (4) | 167.8 (5) | 17 (4) | 161.7 (5.7) | 0.0075 ** | 0.64 |
| Burst 8-10 ave amplitude vs Burst 2-4 | % | 16 (4) | 89.3 (1.4) | 17 (4) | 83.9 (1.9) | 0.29 | 0.092 |
| LTP vs PTP, amplitude ratio | % | 16 (4) | 81.6 (1.9) | 17 (4) | 81.3 (1.7) | 0.32 | 0.92 |
| LTP based on amplitude | % | 16 (4) | 163.6 (4.2) | 17 (4) | 111.2 (1.9) | 0.17 | 0.00013 *** |
Basal Synaptic Transmission
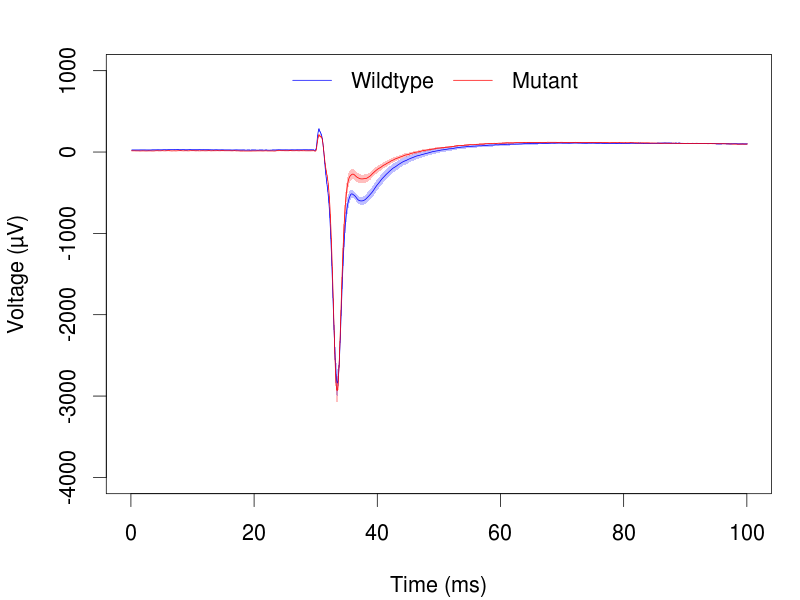
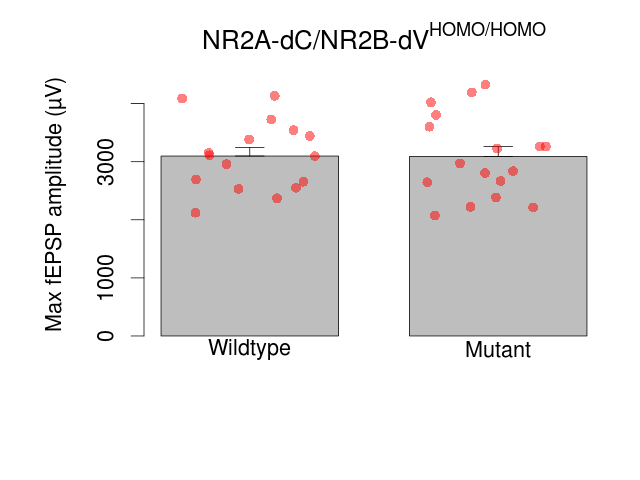
Variables shown are: Max fEPSP amplitude, Maximum field excitatory postsynaptic potential (fEPSP) amplitude.
| Variable | Units | Wildtype slices (animals) | Wildtype mean (SEM) | Mutant slices (animals) | Mutant mean (SEM) | P(animals) | P(mutation) |
|---|---|---|---|---|---|---|---|
| Max fEPSP amplitude | µV | 16 (4) | 3100 (150) | 17 (4) | 3090 (170) | 0.43 | 0.98 |
Paired Pulse Facilitation
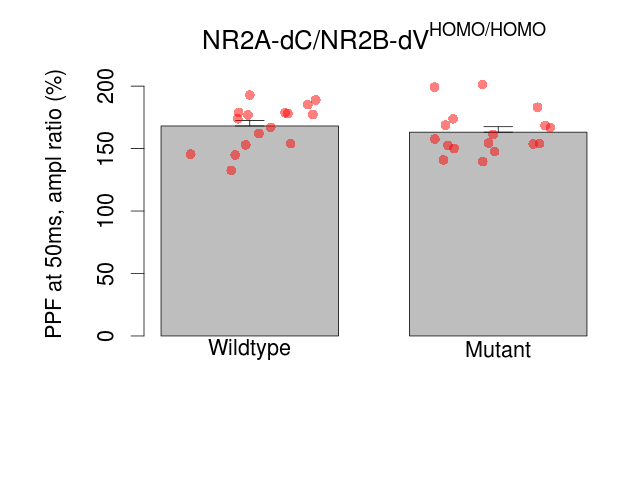
Variables shown are: PPF at 50ms, ampl ratio, Paired pulse facilitation (PPF), pulses separated by 50ms, amplitude ratio.
| Variable | Units | Wildtype slices (animals) | Wildtype mean (SEM) | Mutant slices (animals) | Mutant mean (SEM) | P(animals) | P(mutation) |
|---|---|---|---|---|---|---|---|
| PPF at 50ms, ampl ratio | % | 16 (4) | 168.1 (4.4) | 17 (4) | 163.2 (4.4) | 0.051 | 0.59 |
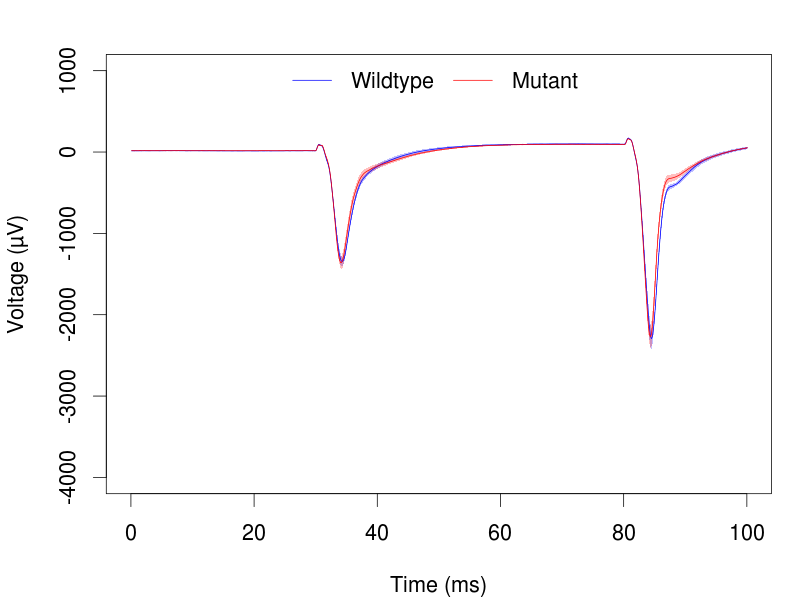
Theta Burst Stimulation
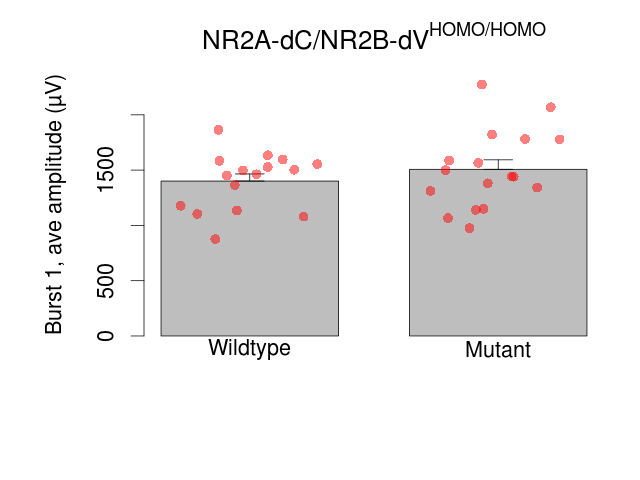
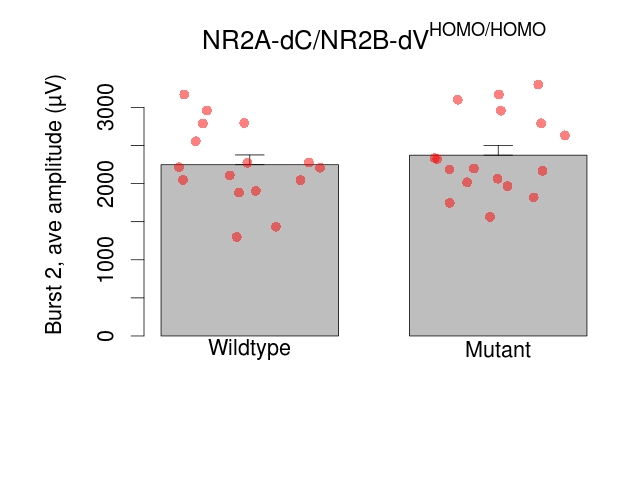


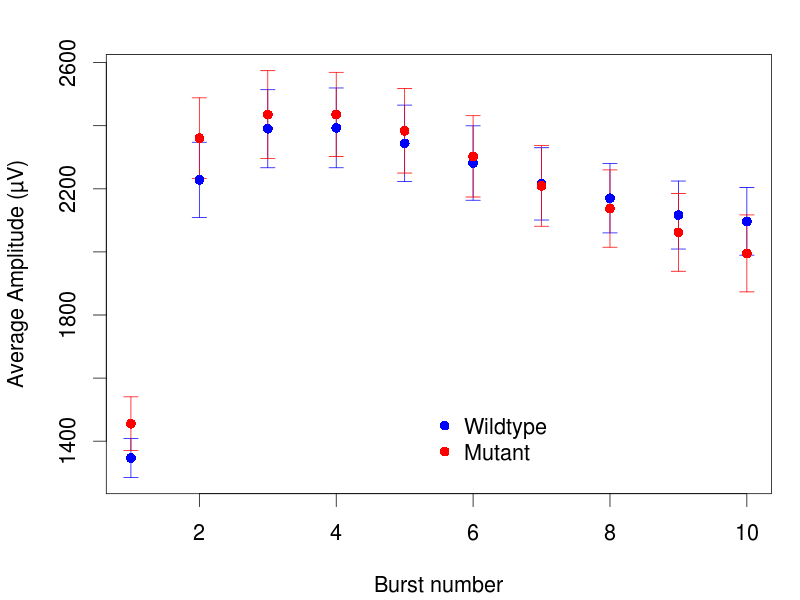
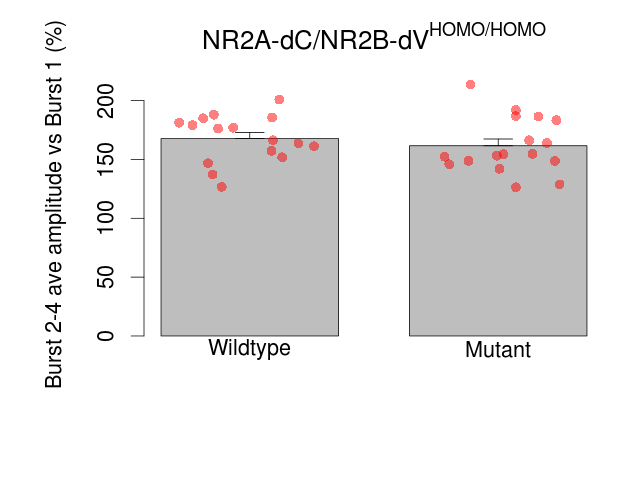
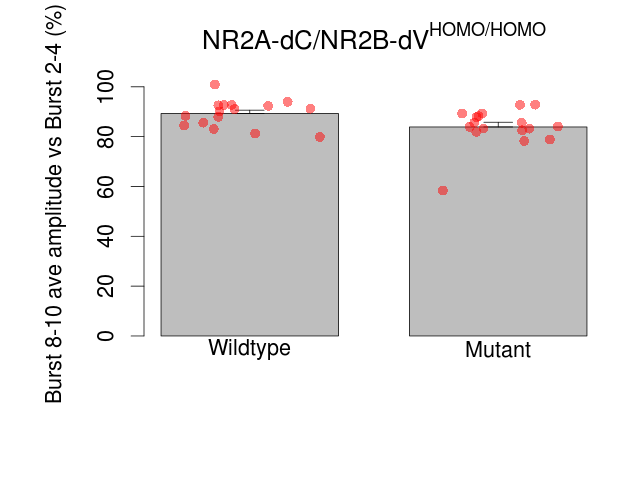
Variables shown are: Burst 1, PPF at 10ms, ampl ratio, Paired pulse facilitation (PPF), pulses separated by 10ms, amplitude ratio, observed during first two pulses of the first 100Hz burst during theta-burst stimulation. Burst 1, EPSP3 depr, ampl ratio, Depression observed in third fEPSP relative to the second fEPSP of the first 100Hz burst, amplitude ratio. Burst 1, ave amplitude, Average amplitude of four fEPSPs in first burst. Burst 2, ave amplitude, Average amplitude of four fEPSPs in second burst. Burst 3, ave amplitude, Average amplitude of four fEPSPs in third burst. Burst 4, ave amplitude, Average amplitude of four fEPSPs in fourth burst. Burst 5, ave amplitude, Average amplitude of four fEPSPs in fifth burst. Burst 6, ave amplitude, Average amplitude of four fEPSPs in sixth burst. Burst 7, ave amplitude, Average amplitude of four fEPSPs in seventh burst. Burst 8, ave amplitude, Average amplitude of four fEPSPs in eighth burst. Burst 9, ave amplitude, Average amplitude of four fEPSPs in ninth burst. Burst 10, ave amplitude, Average amplitude of four fEPSPs in tenth burst. Burst 2-4 ave amplitude vs Burst 1, Facilitation observed in average amplitude of bursts 2-4, relative to average amplitude of burst 1. Burst 8-10 ave amplitude vs Burst 2-4, Depression observed in average amplitude of bursts 8-10, relative to average amplitude of bursts 2-4.
| Variable | Units | Wildtype slices (animals) | Wildtype mean (SEM) | Mutant slices (animals) | Mutant mean (SEM) | P(animals) | P(mutation) |
|---|---|---|---|---|---|---|---|
| Burst 1, PPF at 10ms, ampl ratio | % | 16 (4) | 151.2 (8.1) | 17 (4) | 132.2 (5.8) | 6e-04 *** | 0.32 |
| Burst 1, EPSP3 depr, ampl ratio | % | 16 (4) | 67.6 (2.5) | 17 (4) | 66.3 (3.2) | 0.032 * | 0.83 |
| Burst 1, ave amplitude | µV | 16 (4) | 1401 (64) | 17 (4) | 1507 (86) | 0.054 | 0.51 |
| Burst 2, ave amplitude | µV | 16 (4) | 2250 (130) | 17 (4) | 2370 (130) | 0.35 | 0.55 |
| Burst 3, ave amplitude | µV | 16 (4) | 2410 (130) | 17 (4) | 2450 (140) | 0.49 | 0.84 |
| Burst 4, ave amplitude | µV | 16 (4) | 2400 (130) | 17 (4) | 2440 (130) | 0.66 | 0.8 |
| Burst 5, ave amplitude | µV | 16 (4) | 2350 (120) | 17 (4) | 2390 (130) | 0.75 | 0.78 |
| Burst 6, ave amplitude | µV | 16 (4) | 2280 (110) | 17 (4) | 2300 (130) | 0.8 | 0.86 |
| Burst 7, ave amplitude | µV | 16 (4) | 2200 (110) | 17 (4) | 2200 (130) | 0.81 | 0.98 |
| Burst 8, ave amplitude | µV | 16 (4) | 2150 (110) | 17 (4) | 2120 (120) | 0.86 | 0.8 |
| Burst 9, ave amplitude | µV | 16 (4) | 2090 (100) | 17 (4) | 2040 (120) | 0.86 | 0.65 |
| Burst 10, ave amplitude | µV | 16 (4) | 2060 (100) | 17 (4) | 1960 (120) | 0.87 | 0.39 |
| Burst 2-4 ave amplitude vs Burst 1 | % | 16 (4) | 167.8 (5) | 17 (4) | 161.7 (5.7) | 0.0075 ** | 0.64 |
| Burst 8-10 ave amplitude vs Burst 2-4 | % | 16 (4) | 89.3 (1.4) | 17 (4) | 83.9 (1.9) | 0.29 | 0.092 |
Long Term Potentiation
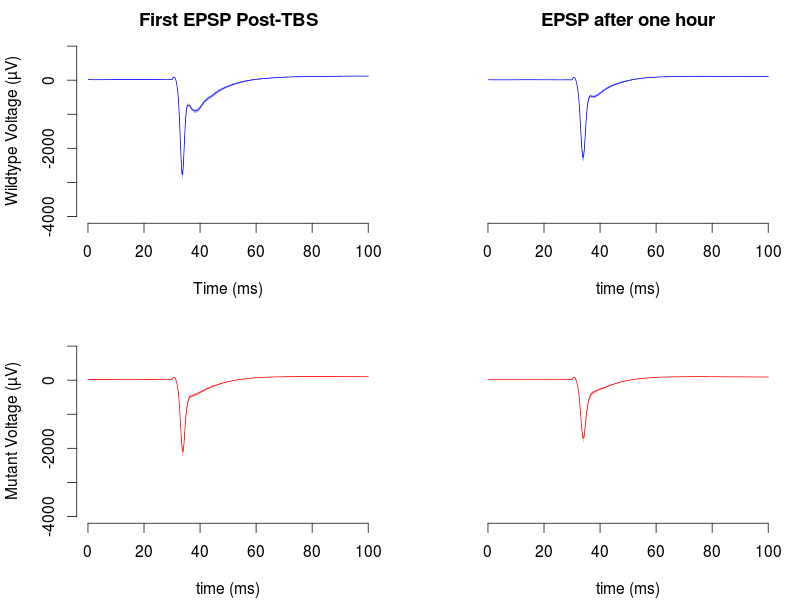
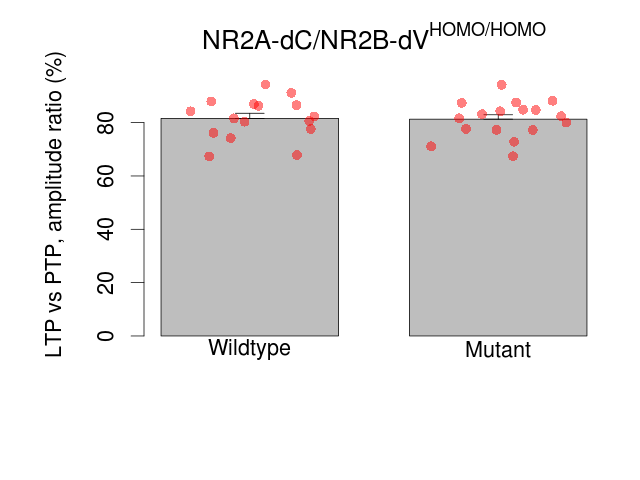
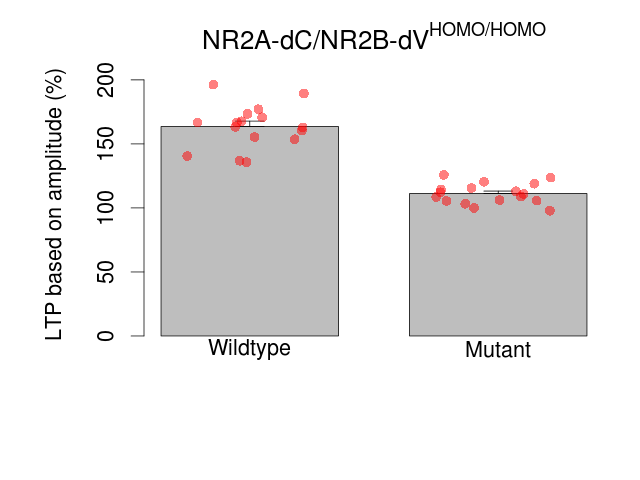
Variables shown are: LTP vs PTP, amplitude ratio, Reduction in potentiation from immediately after theta-burst stimulation to one hour later, fEPSP amplitude ratio. LTP based on amplitude, Long term potentiation, ratio of amplitudes of fEPSPs in test pathway and control pathway.
| Variable | Units | Wildtype slices (animals) | Wildtype mean (SEM) | Mutant slices (animals) | Mutant mean (SEM) | P(animals) | P(mutation) |
|---|---|---|---|---|---|---|---|
| LTP vs PTP, amplitude ratio | % | 16 (4) | 81.6 (1.9) | 17 (4) | 81.3 (1.7) | 0.32 | 0.92 |
| LTP based on amplitude | % | 16 (4) | 163.6 (4.2) | 17 (4) | 111.2 (1.9) | 0.17 | 0.00013 *** |
Hippocampal slice electrophysiology raw data
| Animals and Brain slices | View |
| Field EPSP (Maximum) | View |
| Paired Pulse Facilitation | View |
| Long Term Potentiation | View |
| Data Files | View |