G2C::Genetics
SynGAP knock-out mouse
S.G.N. Grant and the G2C Consortium
Corresponding email: Seth.Grant@ed.ac.uk
G2CMine Data Warehouse
| Syngap1 @ G2CMine |
Genetic and Genomic Information
| Gene symbol | Syngap1 |
| MGI ID | MGI:3039785 |
| G2Cdb mouse | G00000009 |
| Ensembl mouse | ENSMUSG00000067629 |
| G2Cdb human | G00000034 |
| Ensembl human | ENSG00000197283 |
G2CMine Data Warehouse
G2CMine integrates the scientific findings of the Genes to Cognition Programme that utilised neuroproteomics, psychiatric genetics, high-throughput mouse gene targeting combined with behavioural and electrophysiological phenotyping and informatics in order to develop a general strategy for understanding cognition at the molecular, cellular and systems neuroscience levels.
G2CMine provides comprehensive Gene Ontology, Mammalian Phenotype Ontology, Human Phenotype Ontology, UniProt, genetic and protein interactions, and regional mouse brain expression results, together with the phenotyping results of the G2C Programme.
Mutation
Generation of Syngap1 mutant mice described in Komiyama et al (2002)
Genotyping
Syngap1 genotyping described in Komiyama et al (2002)
Expression
Syngap1 expression described in Komiyama et al (2002)
Breeding
No SynGAP-/- mice were produced from SynGAP+/- intercrosses. Male and female SynGAP+/- mice developed normally to adulthood, were fertile, exhibited normal body size and no gross abnormalities. Genotypes of 3-week-old pups from SynGAP+/- intercrosses identified 7 wt and 16 SynGAP+/- progeny (Χ2 p= 0.020). Backcrosses onto the C57BL/6 background were used to maintain the colony and to generate heterozygous and wildtype mice to study.
Overview
Mutant mice showed large overall behavioural difference from wildtypes, with eight of 16 behaviour variables significantly impacted in these mutants. In the elevated plus maze task, three behavioural variables of five were significantly impacted in mutants. In the open field/novel object exploration task, two behavioural variables of two were significantly impacted in mutants. In the rotarod task, two behavioural variables of three were significantly impacted in mutants. In the cued memory task, one behavioural variable, cued memory change, was significantly increased in mutants. Only fear learning and contextual memory tasks were unaffected. Definitions of variables may be found below.
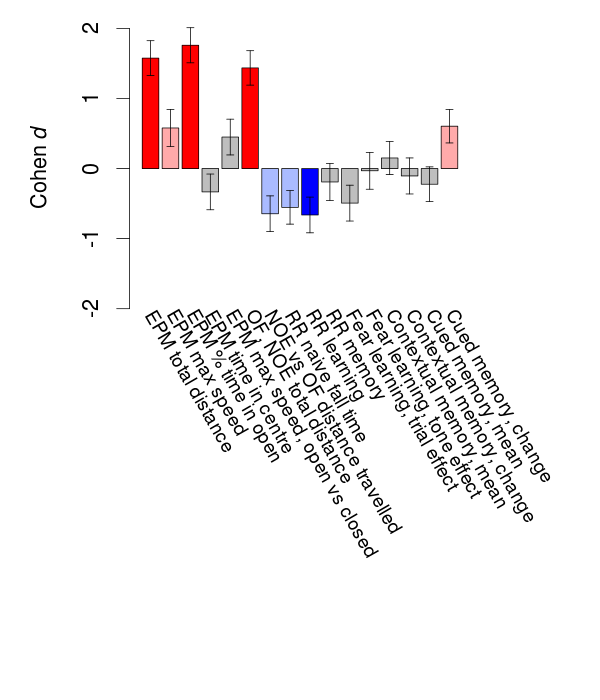
Variables shown are: EPM total distance, Total distance (cm) travelled in any arm or central zone of the EPM. EPM max speed, Maximum speed (cm/s) travelled in any arm or central zone of the EPM. EPM % time in open, Percentage of time in the open or closed arms of the EPM spent in open arms. EPM time in centre, Total time (s) spent in the central zone of the EPM. EPM max speed, open vs closed, Difference between the maximum speed (cm/s) observed in the open arms and the closed arms of the EPM. OF, NOE total distance, Total distance travelled (log₁₀ cm) during initial exposure to the open field and in presence of the novel object. NOE vs OF distance travelled, Difference in distance travelled (cm) in presence of the novel object and during initial exposure to open field. RR naive fall time, Fall time on accelerating rotarod (log₁₀ s), naive performance in session 1. RR learning, Learning on rotarod, measured as increase in fall time per trial (s/trial) in session 1. RR memory, Memory on rotarod, measured as excess fall time at middle of session 2 relative to middle of session 1. Fear learning, trial effect, Fear learning, measured as extra % time freezing before third trial compared to % time freezing before first trial. Fear learning, tone effect, Fear learning, measured as increase in % time freezing due to third tone compared to increase in % time freezing due to first tone. Contextual memory, mean, Contextual memory, measured as difference in % time freezing during first 120 s re-exposure to the box compared to first 120 s in the box on previous day. Contextual memory, change, Contextual memory, measured as increase in % time spent freezing from first time bin of 30 s to fourth bin of 30 s during 120 s re-exposure to the box. Cued memory, mean, Cued memory, measured as increase in % time spent freezing during 120 s of tone re-exposure compared to increase in % time spent freezing during initial tone on previous day. Cued memory, change, Cued memory, measured as increase in % time spent freezing from first time bin of 30 s to fourth bin of 30 s during 120 s re-exposure to the tone.
| Variable | Units | Wildtype M (n=24) | Wildtype F (n=17) | Mutant M (n=11) | Mutant F (n=16) | P(sex×mutation) | P(mutation) |
|---|---|---|---|---|---|---|---|
| EPM total distance | cm | 1246 (71) | 1324 (86) | 1694 (177) | 2247 (143) | 0.041 * | 0.000000064 *** |
| EPM max speed | cm/s | 27.4 (1.8) | 26.3 (1.4) | 28.3 (1.4) | 32.5 (1.4) | 0.13 | 0.033 * |
| EPM % time in open | % | 17 (2.6) | 18.1 (2.9) | 45.1 (7.7) | 49.1 (5.5) | 0.73 | 6e-09 *** |
| EPM time in centre | s | 50.7 (3.8) | 49.2 (4.7) | 52 (6.7) | 38.7 (2.6) | 0.19 | 0.29 |
| EPM max speed, open vs closed | cm/s | -5.9 (2) | -2.2 (1.1) | -2.6 (1.4) | -0.3 (1.2) | 0.69 | 0.15 |
| OF, NOE total distance | log10 cm | 3.69 (0.02) | 3.72 (0.03) | 3.82 (0.03) | 3.86 (0.03) | 0.89 | 0.0000011 *** |
| NOE vs OF distance travelled | cm | -1360 (140) | -1450 (250) | -2100 (260) | -1790 (180) | 0.33 | 0.013 * |
| RR naive fall time | log10 s | 1.41 (0.07) | 1.63 (0.06) | 1.22 (0.12) | 1.37 (0.11) | 0.7 | 0.012 * |
| RR learning | s/trial | 5.7 (1) | 11.1 (1.7) | 3.7 (0.9) | 4.6 (1.3) | 0.1 | 0.0021 ** |
| RR memory | s | 22.7 (4.3) | 30.8 (7.4) | 21.5 (4.1) | 21.8 (5.7) | 0.51 | 0.37 |
| Fear learning, trial effect | % freezing | 46.9 (4.4) | 44.4 (5.4) | 45.5 (6) | 28.1 (5.5) | 0.18 | 0.095 |
| Fear learning, tone effect | % freezing | 0.9 (3.4) | -1.3 (7.8) | -2.1 (7.7) | 0.2 (4.8) | 0.71 | 0.91 |
| Contextual memory, mean | % freezing | 39.1 (4.4) | 30 (3.9) | 45.2 (8.6) | 34.5 (7.2) | 0.9 | 0.38 |
| Contextual memory, change | % freezing | 13.1 (5.4) | 12.6 (5.6) | 5.8 (5.5) | 13.7 (4.9) | 0.47 | 0.62 |
| Cued memory, mean | % freezing | 7.4 (5.6) | 0.1 (6.8) | -2.4 (5.5) | -0.6 (6.6) | 0.49 | 0.45 |
| Cued memory, change | % freezing | -8.7 (4) | 0.6 (4.7) | 11.9 (3.7) | 6.2 (8.1) | 0.19 | 0.027 * |
Elevated Plus Maze
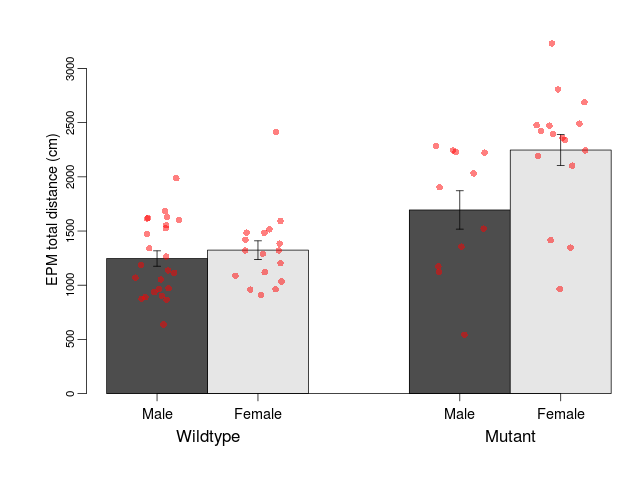
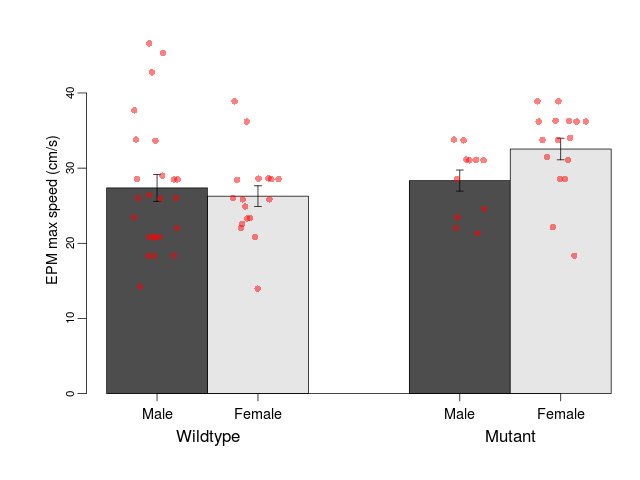
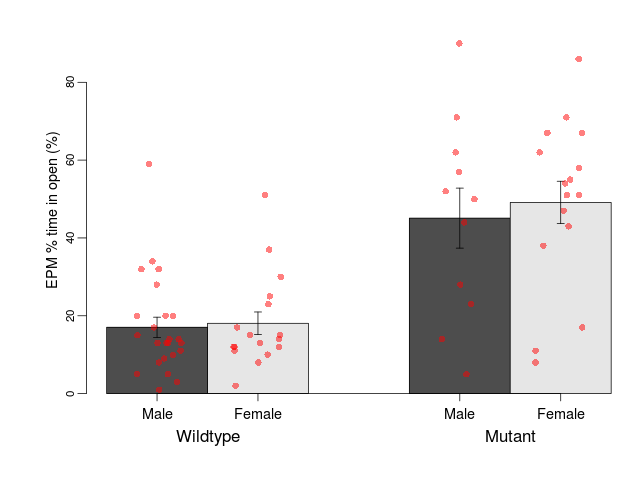
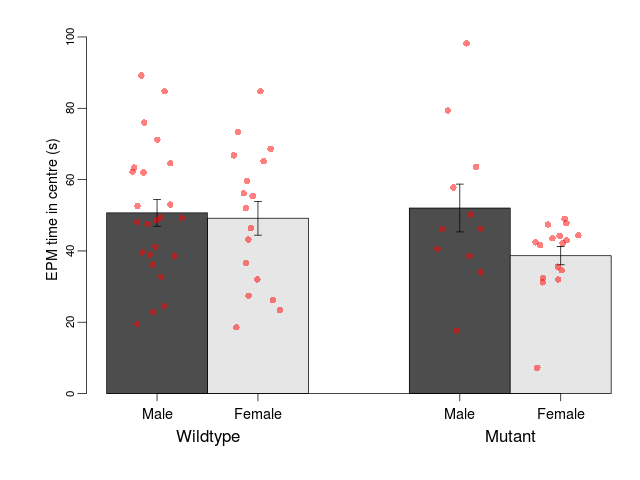
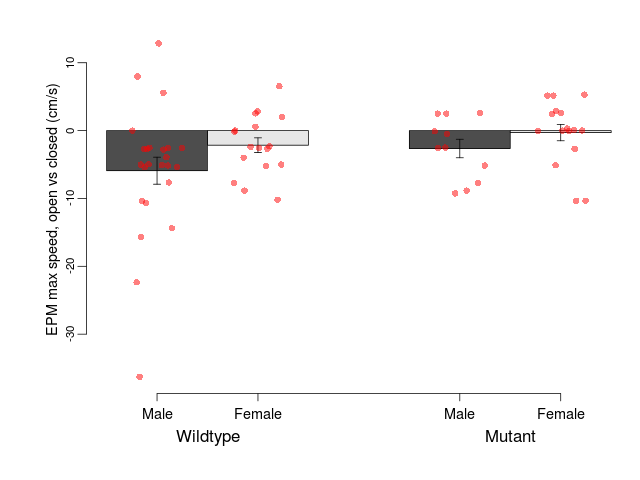
Variables shown are: EPM total distance, Total distance (cm) travelled in any arm or central zone of the EPM. EPM max speed, Maximum speed (cm/s) travelled in any arm or central zone of the EPM. EPM % time in open, Percentage of time in the open or closed arms of the EPM spent in open arms. EPM time in centre, Total time (s) spent in the central zone of the EPM. EPM max speed, open vs closed, Difference between the maximum speed (cm/s) observed in the open arms and the closed arms of the EPM.
| Variable | Units | Wildtype M (n=24) | Wildtype F (n=17) | Mutant M (n=11) | Mutant F (n=16) | P(sex×mutation) | P(mutation) |
|---|---|---|---|---|---|---|---|
| EPM total distance | cm | 1246 (71) | 1324 (86) | 1694 (177) | 2247 (143) | 0.041 * | 0.000000064 *** |
| EPM max speed | cm/s | 27.4 (1.8) | 26.3 (1.4) | 28.3 (1.4) | 32.5 (1.4) | 0.13 | 0.033 * |
| EPM % time in open | % | 17 (2.6) | 18.1 (2.9) | 45.1 (7.7) | 49.1 (5.5) | 0.73 | 6e-09 *** |
| EPM time in centre | s | 50.7 (3.8) | 49.2 (4.7) | 52 (6.7) | 38.7 (2.6) | 0.19 | 0.29 |
| EPM max speed, open vs closed | cm/s | -5.9 (2) | -2.2 (1.1) | -2.6 (1.4) | -0.3 (1.2) | 0.69 | 0.15 |
Open Field/Novel Object
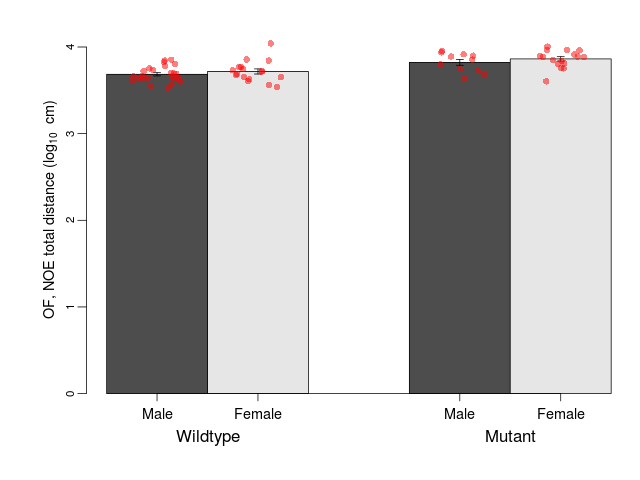
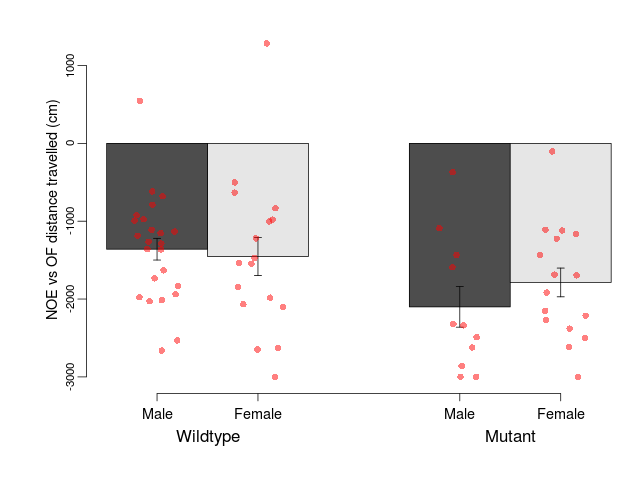
Variables shown are: OF, NOE total distance, Total distance travelled (log₁₀ cm) during initial exposure to the open field and in presence of the novel object. NOE vs OF distance travelled, Difference in distance travelled (cm) in presence of the novel object and during initial exposure to open field.
| Variable | Units | Wildtype M (n=24) | Wildtype F (n=17) | Mutant M (n=11) | Mutant F (n=16) | P(sex×mutation) | P(mutation) |
|---|---|---|---|---|---|---|---|
| OF, NOE total distance | log10 cm | 3.69 (0.02) | 3.72 (0.03) | 3.82 (0.03) | 3.86 (0.03) | 0.89 | 0.0000011 *** |
| NOE vs OF distance travelled | cm | -1360 (140) | -1450 (250) | -2100 (260) | -1790 (180) | 0.33 | 0.013 * |
Rotarod
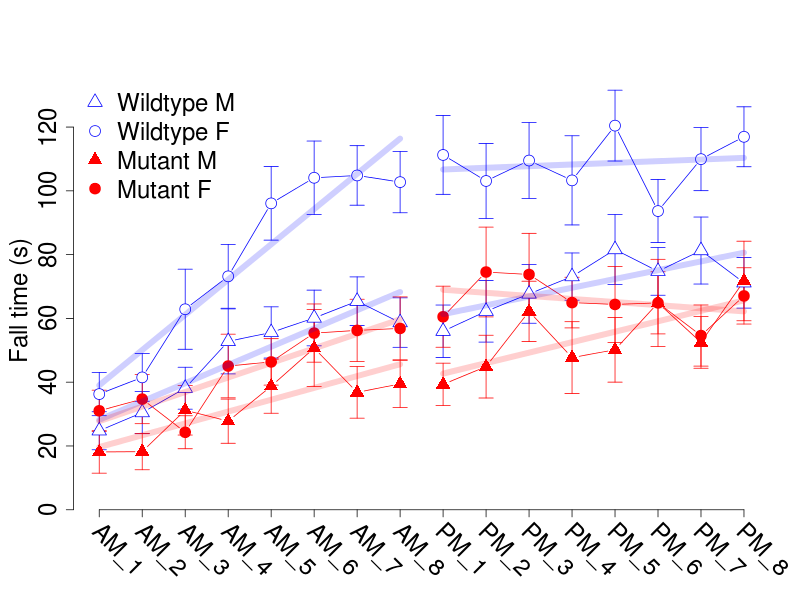
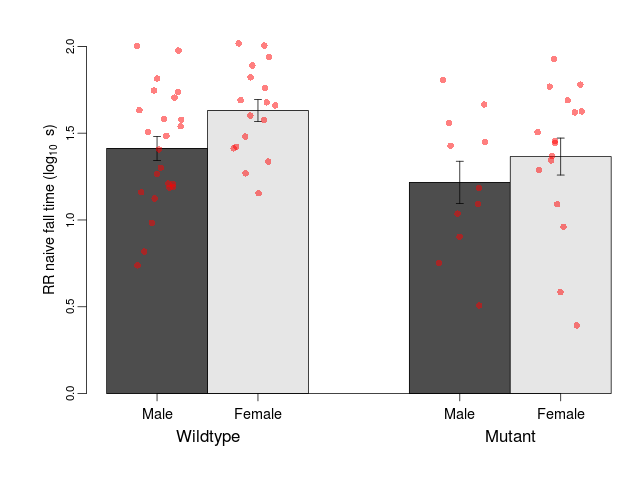
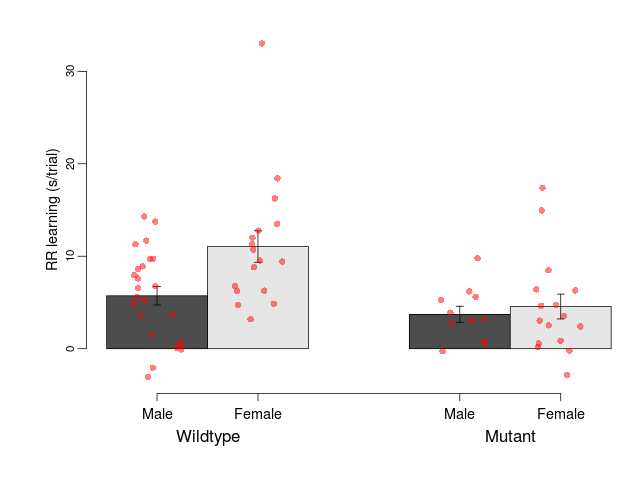
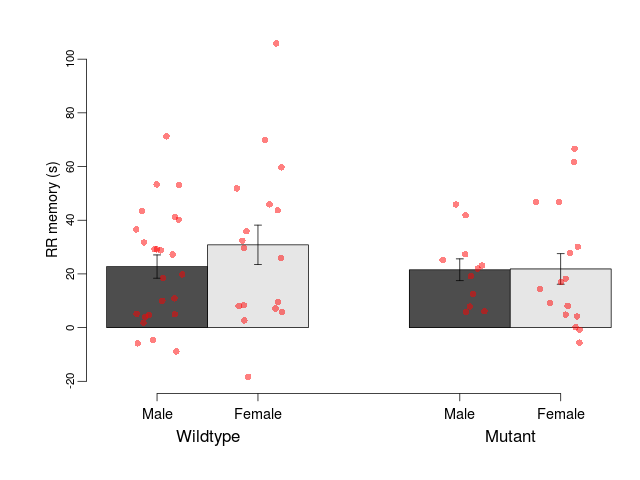
Variables shown are: RR naive fall time, Fall time on accelerating rotarod (log₁₀ s), naive performance in session 1. RR learning, Learning on rotarod, measured as increase in fall time per trial (s/trial) in session 1. RR memory, Memory on rotarod, measured as excess fall time at middle of session 2 relative to middle of session 1.
| Variable | Units | Wildtype M (n=24) | Wildtype F (n=17) | Mutant M (n=11) | Mutant F (n=16) | P(sex×mutation) | P(mutation) |
|---|---|---|---|---|---|---|---|
| RR naive fall time | log10 s | 1.41 (0.07) | 1.63 (0.06) | 1.22 (0.12) | 1.37 (0.11) | 0.7 | 0.012 * |
| RR learning | s/trial | 5.7 (1) | 11.1 (1.7) | 3.7 (0.9) | 4.6 (1.3) | 0.1 | 0.0021 ** |
| RR memory | s | 22.7 (4.3) | 30.8 (7.4) | 21.5 (4.1) | 21.8 (5.7) | 0.51 | 0.37 |
Fear Conditioning
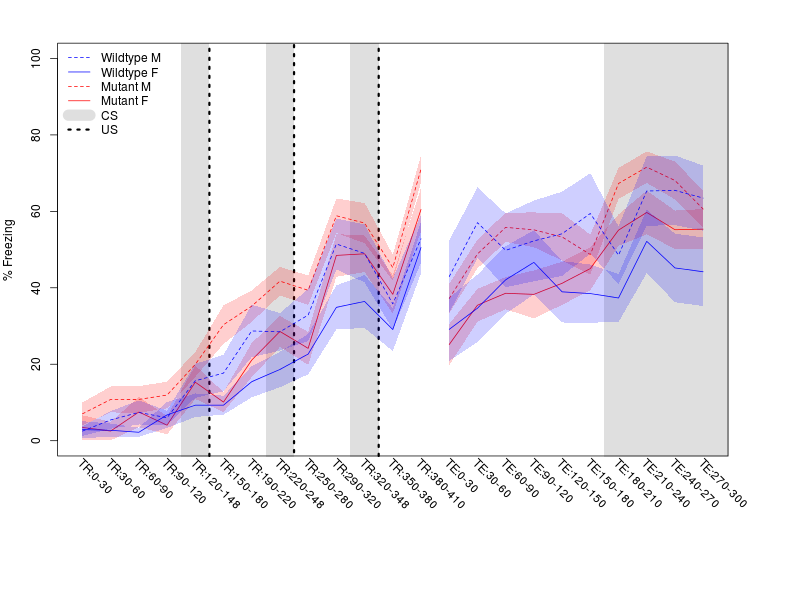
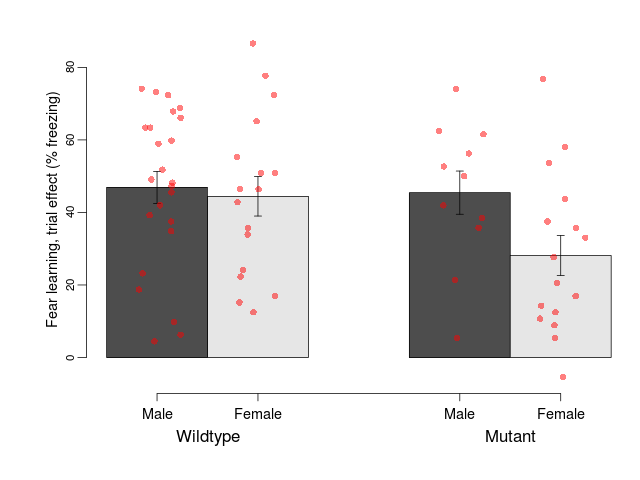
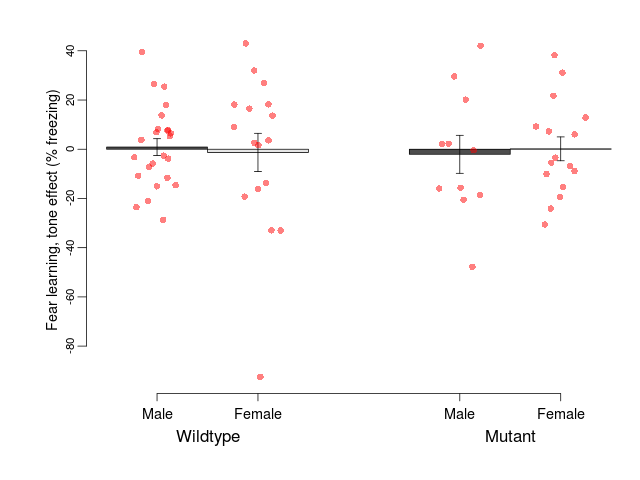
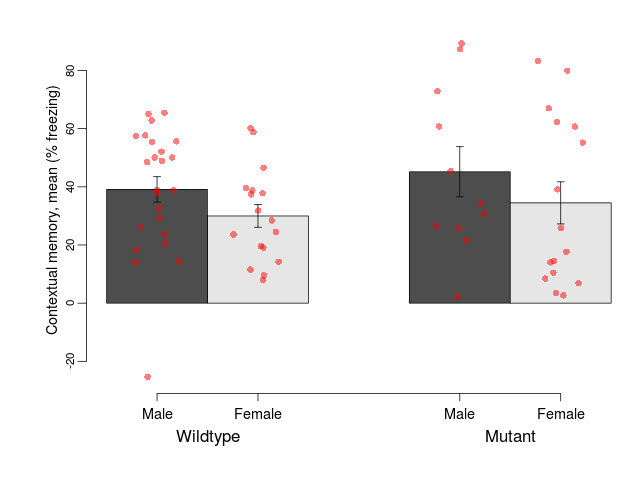
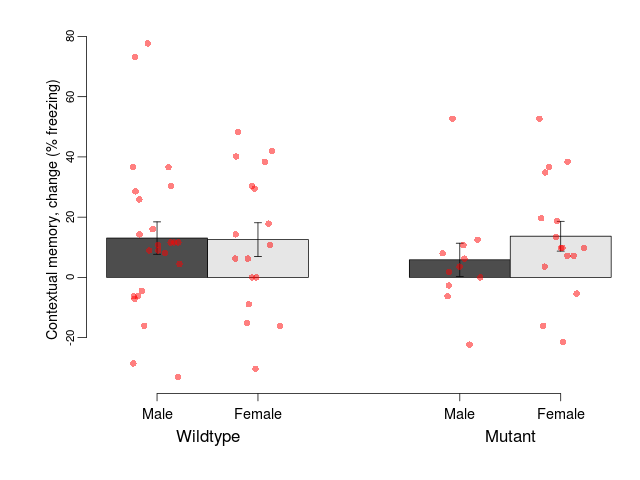
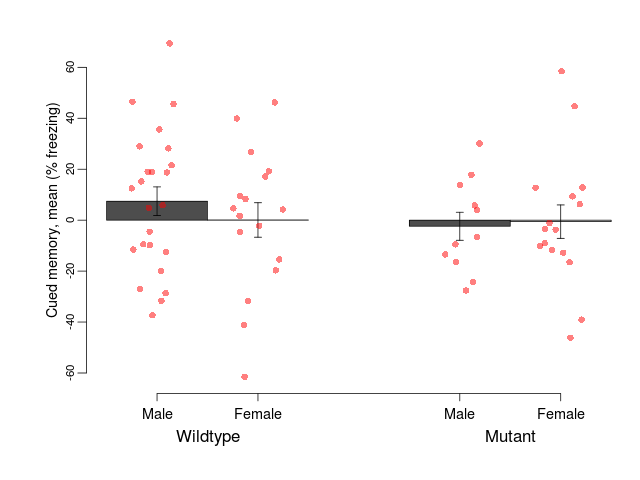
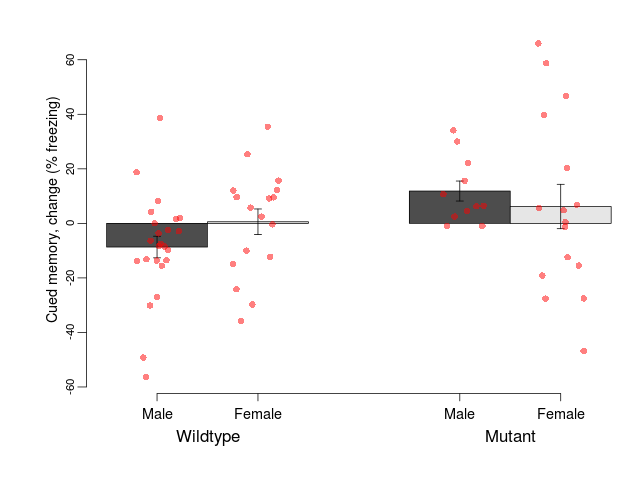
Variables shown are: Fear learning, trial effect, Fear learning, measured as extra % time freezing before third trial compared to % time freezing before first trial. Fear learning, tone effect, Fear learning, measured as increase in % time freezing due to third tone compared to increase in % time freezing due to first tone. Contextual memory, mean, Contextual memory, measured as difference in % time freezing during first 120 s re-exposure to the box compared to first 120 s in the box on previous day. Contextual memory, change, Contextual memory, measured as increase in % time spent freezing from first time bin of 30 s to fourth bin of 30 s during 120 s re-exposure to the box. Cued memory, mean, Cued memory, measured as increase in % time spent freezing during 120 s of tone re-exposure compared to increase in % time spent freezing during initial tone on previous day. Cued memory, change, Cued memory, measured as increase in % time spent freezing from first time bin of 30 s to fourth bin of 30 s during 120 s re-exposure to the tone.
| Variable | Units | Wildtype M (n=24) | Wildtype F (n=17) | Mutant M (n=11) | Mutant F (n=16) | P(sex×mutation) | P(mutation) |
|---|---|---|---|---|---|---|---|
| Fear learning, trial effect | % freezing | 46.9 (4.4) | 44.4 (5.4) | 45.5 (6) | 28.1 (5.5) | 0.18 | 0.095 |
| Fear learning, tone effect | % freezing | 0.9 (3.4) | -1.3 (7.8) | -2.1 (7.7) | 0.2 (4.8) | 0.71 | 0.91 |
| Contextual memory, mean | % freezing | 39.1 (4.4) | 30 (3.9) | 45.2 (8.6) | 34.5 (7.2) | 0.9 | 0.38 |
| Contextual memory, change | % freezing | 13.1 (5.4) | 12.6 (5.6) | 5.8 (5.5) | 13.7 (4.9) | 0.47 | 0.62 |
| Cued memory, mean | % freezing | 7.4 (5.6) | 0.1 (6.8) | -2.4 (5.5) | -0.6 (6.6) | 0.49 | 0.45 |
| Cued memory, change | % freezing | -8.7 (4) | 0.6 (4.7) | 11.9 (3.7) | 6.2 (8.1) | 0.19 | 0.027 * |
- Overview
- Basal Synaptic Transmission
- Paired Pulse Facilitation
- Theta Burst Stimulation
- Long Term Potentiation
Overview
Mutant slices showed medium overall electrophysiological difference from wildtype slices, with two of nine variables significantly impacted by this mutation. In the long term potentiation experiment, two electrophysiological variables of two were significantly impacted in mutants. Basal synaptic transmission, paired pulse facilitation and theta burst stimulation experiments were unaffected. Note that in the theta burst analysis, the tenth burst is analysed as representative of individual burst amplitude. Definitions of variables may be found below.
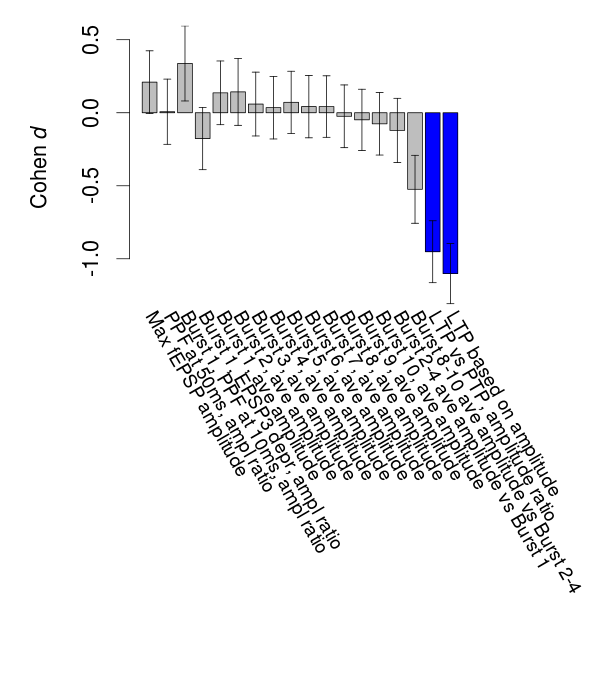
Variables shown are: Max fEPSP amplitude, Maximum field excitatory postsynaptic potential (fEPSP) amplitude. PPF at 50ms, ampl ratio, Paired pulse facilitation (PPF), pulses separated by 50ms, amplitude ratio. Burst 1, PPF at 10ms, ampl ratio, Paired pulse facilitation (PPF), pulses separated by 10ms, amplitude ratio, observed during first two pulses of the first 100Hz burst during theta-burst stimulation. Burst 1, EPSP3 depr, ampl ratio, Depression observed in third fEPSP relative to the second fEPSP of the first 100Hz burst, amplitude ratio. Burst 1, ave amplitude, Average amplitude of four fEPSPs in first burst. Burst 2, ave amplitude, Average amplitude of four fEPSPs in second burst. Burst 3, ave amplitude, Average amplitude of four fEPSPs in third burst. Burst 4, ave amplitude, Average amplitude of four fEPSPs in fourth burst. Burst 5, ave amplitude, Average amplitude of four fEPSPs in fifth burst. Burst 6, ave amplitude, Average amplitude of four fEPSPs in sixth burst. Burst 7, ave amplitude, Average amplitude of four fEPSPs in seventh burst. Burst 8, ave amplitude, Average amplitude of four fEPSPs in eighth burst. Burst 9, ave amplitude, Average amplitude of four fEPSPs in ninth burst. Burst 10, ave amplitude, Average amplitude of four fEPSPs in tenth burst. Burst 2-4 ave amplitude vs Burst 1, Facilitation observed in average amplitude of bursts 2-4, relative to average amplitude of burst 1. Burst 8-10 ave amplitude vs Burst 2-4, Depression observed in average amplitude of bursts 8-10, relative to average amplitude of bursts 2-4. LTP vs PTP, amplitude ratio, Reduction in potentiation from immediately after theta-burst stimulation to one hour later, fEPSP amplitude ratio. LTP based on amplitude, Long term potentiation, ratio of amplitudes of fEPSPs in test pathway and control pathway.
| Variable | Units | Wildtype slices (animals) | Wildtype mean (SEM) | Mutant slices (animals) | Mutant mean (SEM) | P(animals) | P(mutation) |
|---|---|---|---|---|---|---|---|
| Max fEPSP amplitude | µV | 41 (14) | 3034 (101) | 52 (18) | 3176 (98) | 0.11 | 0.39 |
| PPF at 50ms, ampl ratio | % | 18 (6) | 180.7 (4.8) | 22 (7) | 180.8 (4.3) | 0.081 | 0.99 |
| Burst 1, PPF at 10ms, ampl ratio | % | 34 (11) | 185.2 (4.6) | 32 (10) | 194.7 (5.2) | 0.16 | 0.23 |
| Burst 1, EPSP3 depr, ampl ratio | % | 34 (11) | 64.7 (2.1) | 32 (10) | 62.7 (1.9) | 0.43 | 0.5 |
| Burst 1, ave amplitude | µV | 34 (11) | 1348 (50) | 32 (10) | 1389 (56) | 0.045 * | 0.65 |
| Burst 2, ave amplitude | µV | 34 (11) | 2228 (81) | 32 (10) | 2303 (101) | 0.2 | 0.6 |
| Burst 3, ave amplitude | µV | 34 (11) | 2458 (85) | 32 (10) | 2491 (105) | 0.24 | 0.83 |
| Burst 4, ave amplitude | µV | 34 (11) | 2504 (80) | 32 (10) | 2523 (101) | 0.27 | 0.9 |
| Burst 5, ave amplitude | µV | 34 (11) | 2449 (76) | 32 (10) | 2486 (100) | 0.29 | 0.79 |
| Burst 6, ave amplitude | µV | 34 (11) | 2385 (72) | 32 (10) | 2406 (100) | 0.33 | 0.87 |
| Burst 7, ave amplitude | µV | 34 (11) | 2297 (72) | 32 (10) | 2318 (96) | 0.31 | 0.87 |
| Burst 8, ave amplitude | µV | 34 (11) | 2242 (67) | 32 (10) | 2230 (94) | 0.36 | 0.92 |
| Burst 9, ave amplitude | µV | 34 (11) | 2175 (68) | 32 (10) | 2152 (94) | 0.44 | 0.85 |
| Burst 10, ave amplitude | µV | 34 (11) | 2121 (66) | 32 (10) | 2086 (91) | 0.33 | 0.77 |
| Burst 2-4 ave amplitude vs Burst 1 | % | 34 (11) | 179.6 (4.6) | 32 (10) | 176.6 (4.1) | 0.031 * | 0.7 |
| Burst 8-10 ave amplitude vs Burst 2-4 | % | 34 (11) | 91.8 (1.1) | 32 (10) | 88.4 (1.2) | 0.2 | 0.069 |
| LTP vs PTP, amplitude ratio | % | 34 (11) | 80.1 (1.1) | 32 (10) | 75.6 (0.6) | 0.34 | 0.0022 ** |
| LTP based on amplitude | % | 34 (11) | 170.5 (4) | 32 (10) | 147.8 (3.2) | 0.96 | 1.1e-05 *** |
Basal Synaptic Transmission
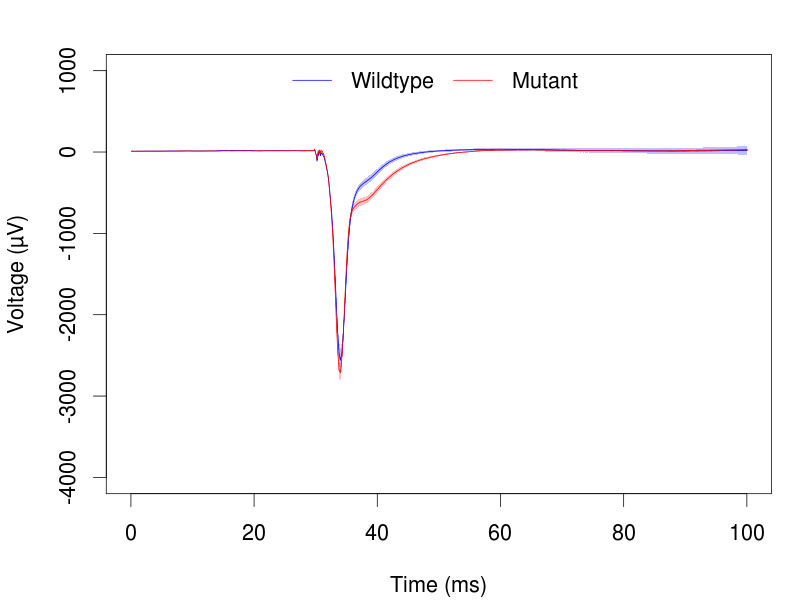
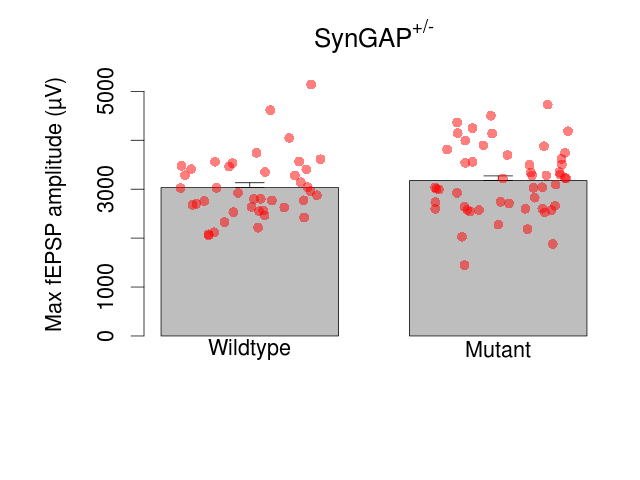
Variables shown are: Max fEPSP amplitude, Maximum field excitatory postsynaptic potential (fEPSP) amplitude.
| Variable | Units | Wildtype slices (animals) | Wildtype mean (SEM) | Mutant slices (animals) | Mutant mean (SEM) | P(animals) | P(mutation) |
|---|---|---|---|---|---|---|---|
| Max fEPSP amplitude | µV | 41 (14) | 3034 (101) | 52 (18) | 3176 (98) | 0.11 | 0.39 |
Paired Pulse Facilitation
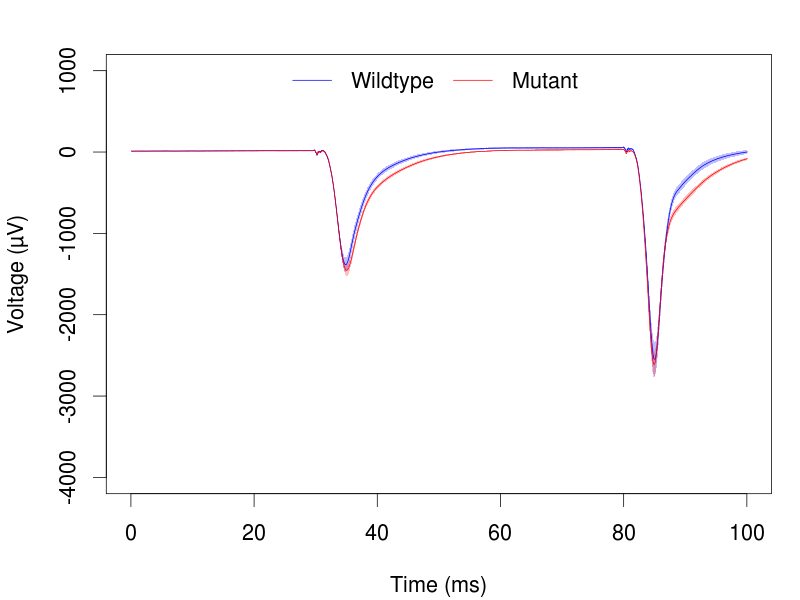
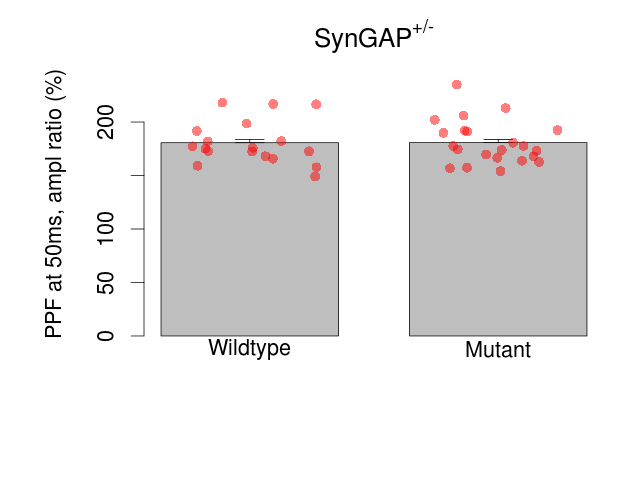
Variables shown are: PPF at 50ms, ampl ratio, Paired pulse facilitation (PPF), pulses separated by 50ms, amplitude ratio.
| Variable | Units | Wildtype slices (animals) | Wildtype mean (SEM) | Mutant slices (animals) | Mutant mean (SEM) | P(animals) | P(mutation) |
|---|---|---|---|---|---|---|---|
| PPF at 50ms, ampl ratio | % | 18 (6) | 180.7 (4.8) | 22 (7) | 180.8 (4.3) | 0.081 | 0.99 |
Theta Burst Stimulation
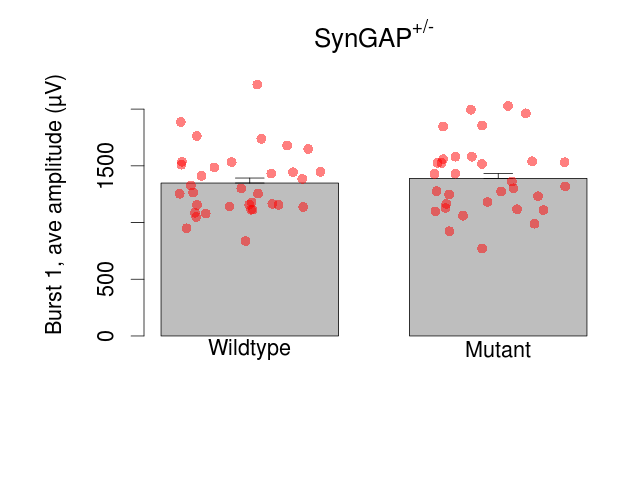
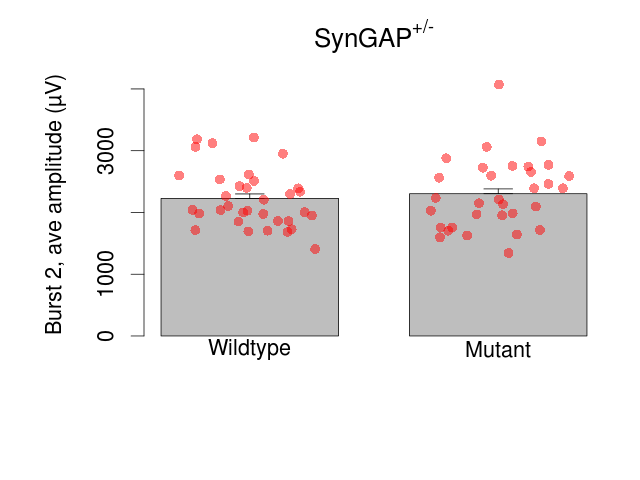
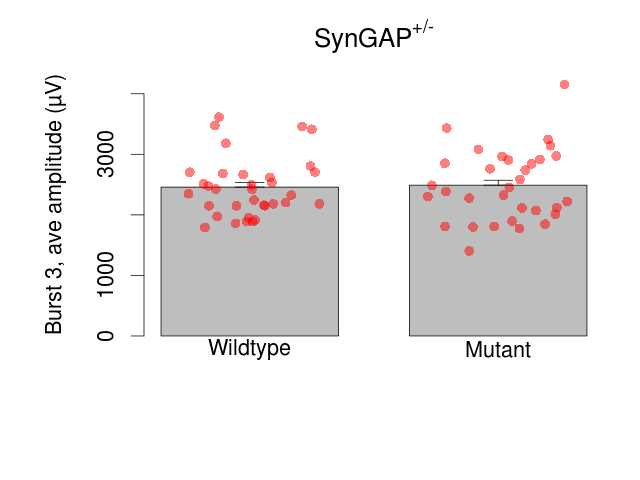
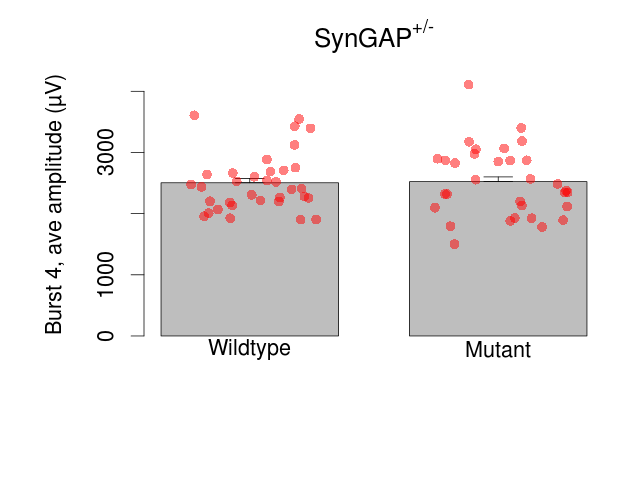
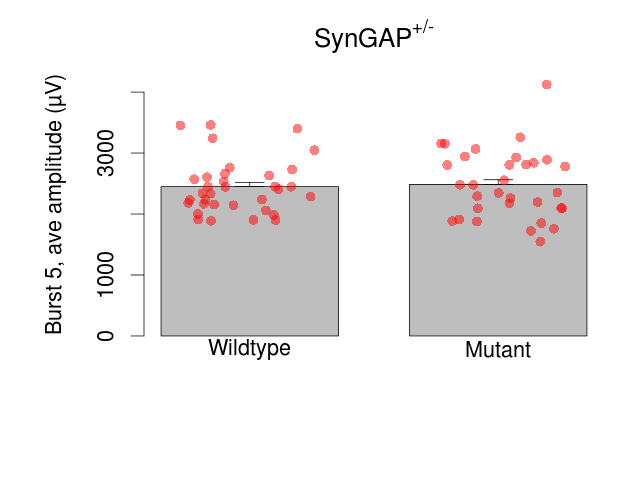
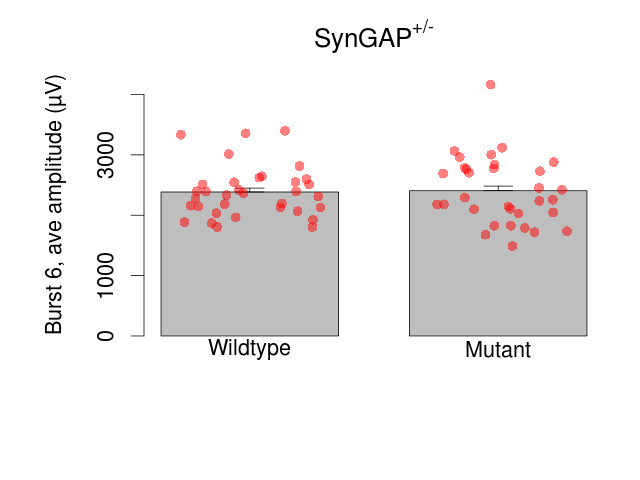
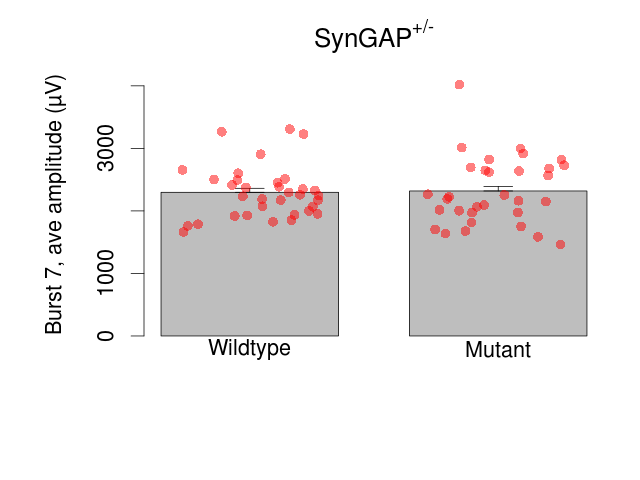
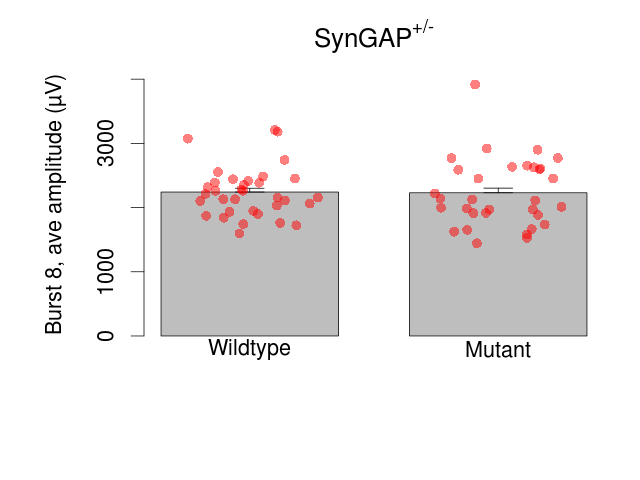
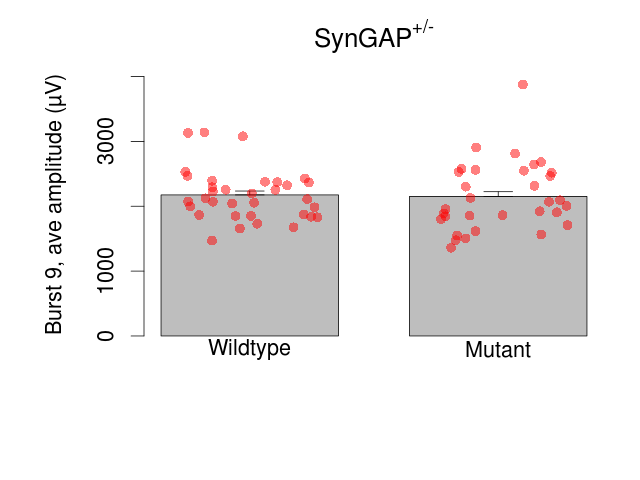
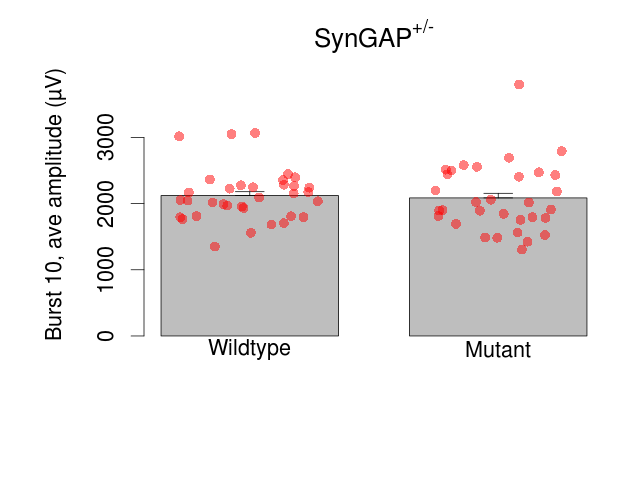
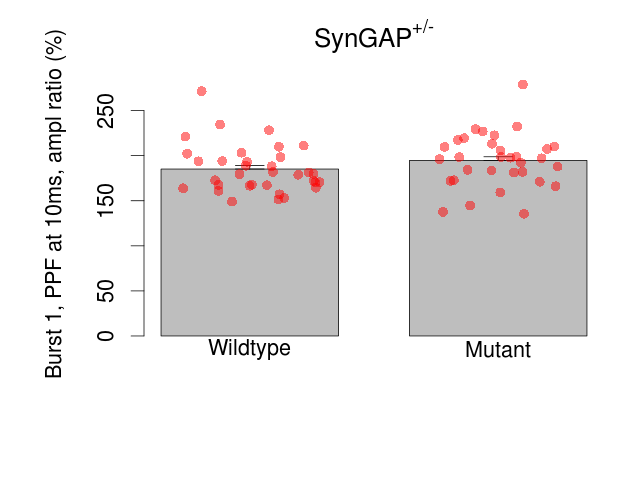
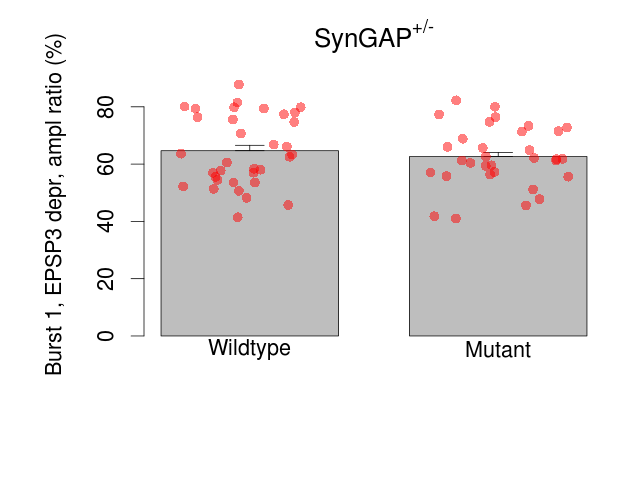
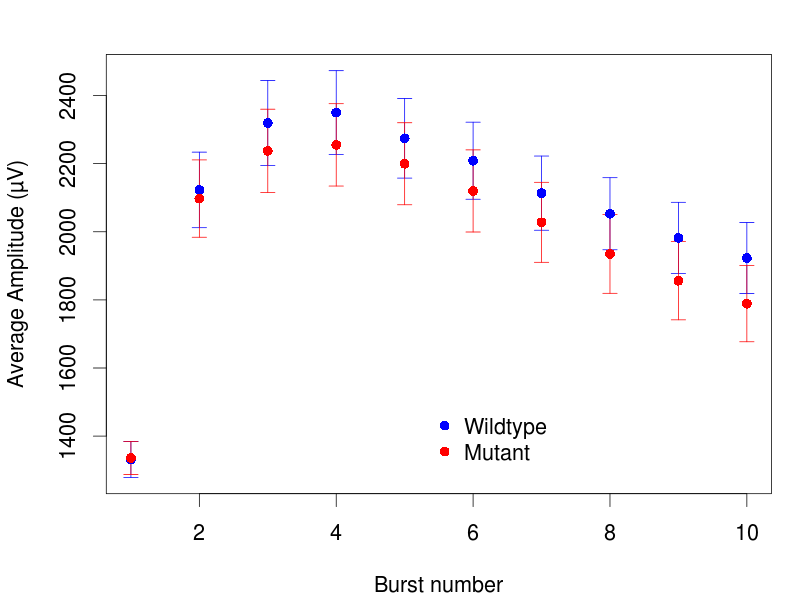
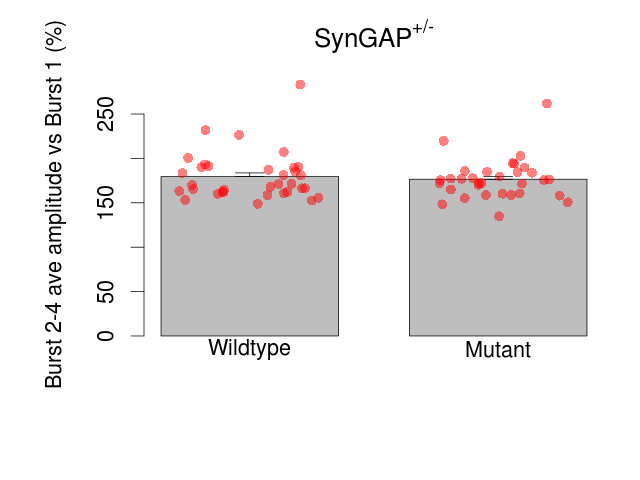
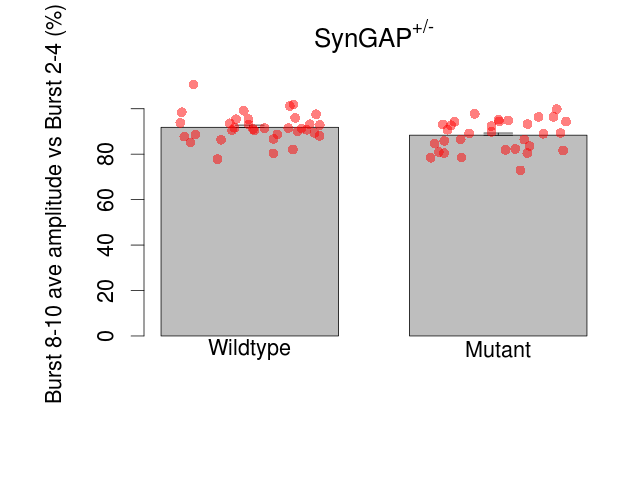
Variables shown are: Burst 1, PPF at 10ms, ampl ratio, Paired pulse facilitation (PPF), pulses separated by 10ms, amplitude ratio, observed during first two pulses of the first 100Hz burst during theta-burst stimulation. Burst 1, EPSP3 depr, ampl ratio, Depression observed in third fEPSP relative to the second fEPSP of the first 100Hz burst, amplitude ratio. Burst 1, ave amplitude, Average amplitude of four fEPSPs in first burst. Burst 2, ave amplitude, Average amplitude of four fEPSPs in second burst. Burst 3, ave amplitude, Average amplitude of four fEPSPs in third burst. Burst 4, ave amplitude, Average amplitude of four fEPSPs in fourth burst. Burst 5, ave amplitude, Average amplitude of four fEPSPs in fifth burst. Burst 6, ave amplitude, Average amplitude of four fEPSPs in sixth burst. Burst 7, ave amplitude, Average amplitude of four fEPSPs in seventh burst. Burst 8, ave amplitude, Average amplitude of four fEPSPs in eighth burst. Burst 9, ave amplitude, Average amplitude of four fEPSPs in ninth burst. Burst 10, ave amplitude, Average amplitude of four fEPSPs in tenth burst. Burst 2-4 ave amplitude vs Burst 1, Facilitation observed in average amplitude of bursts 2-4, relative to average amplitude of burst 1. Burst 8-10 ave amplitude vs Burst 2-4, Depression observed in average amplitude of bursts 8-10, relative to average amplitude of bursts 2-4.
| Variable | Units | Wildtype slices (animals) | Wildtype mean (SEM) | Mutant slices (animals) | Mutant mean (SEM) | P(animals) | P(mutation) |
|---|---|---|---|---|---|---|---|
| Burst 1, PPF at 10ms, ampl ratio | % | 34 (11) | 185.2 (4.6) | 32 (10) | 194.7 (5.2) | 0.16 | 0.23 |
| Burst 1, EPSP3 depr, ampl ratio | % | 34 (11) | 64.7 (2.1) | 32 (10) | 62.7 (1.9) | 0.43 | 0.5 |
| Burst 1, ave amplitude | µV | 34 (11) | 1348 (50) | 32 (10) | 1389 (56) | 0.045 * | 0.65 |
| Burst 2, ave amplitude | µV | 34 (11) | 2228 (81) | 32 (10) | 2303 (101) | 0.2 | 0.6 |
| Burst 3, ave amplitude | µV | 34 (11) | 2458 (85) | 32 (10) | 2491 (105) | 0.24 | 0.83 |
| Burst 4, ave amplitude | µV | 34 (11) | 2504 (80) | 32 (10) | 2523 (101) | 0.27 | 0.9 |
| Burst 5, ave amplitude | µV | 34 (11) | 2449 (76) | 32 (10) | 2486 (100) | 0.29 | 0.79 |
| Burst 6, ave amplitude | µV | 34 (11) | 2385 (72) | 32 (10) | 2406 (100) | 0.33 | 0.87 |
| Burst 7, ave amplitude | µV | 34 (11) | 2297 (72) | 32 (10) | 2318 (96) | 0.31 | 0.87 |
| Burst 8, ave amplitude | µV | 34 (11) | 2242 (67) | 32 (10) | 2230 (94) | 0.36 | 0.92 |
| Burst 9, ave amplitude | µV | 34 (11) | 2175 (68) | 32 (10) | 2152 (94) | 0.44 | 0.85 |
| Burst 10, ave amplitude | µV | 34 (11) | 2121 (66) | 32 (10) | 2086 (91) | 0.33 | 0.77 |
| Burst 2-4 ave amplitude vs Burst 1 | % | 34 (11) | 179.6 (4.6) | 32 (10) | 176.6 (4.1) | 0.031 * | 0.7 |
| Burst 8-10 ave amplitude vs Burst 2-4 | % | 34 (11) | 91.8 (1.1) | 32 (10) | 88.4 (1.2) | 0.2 | 0.069 |
Long Term Potentiation
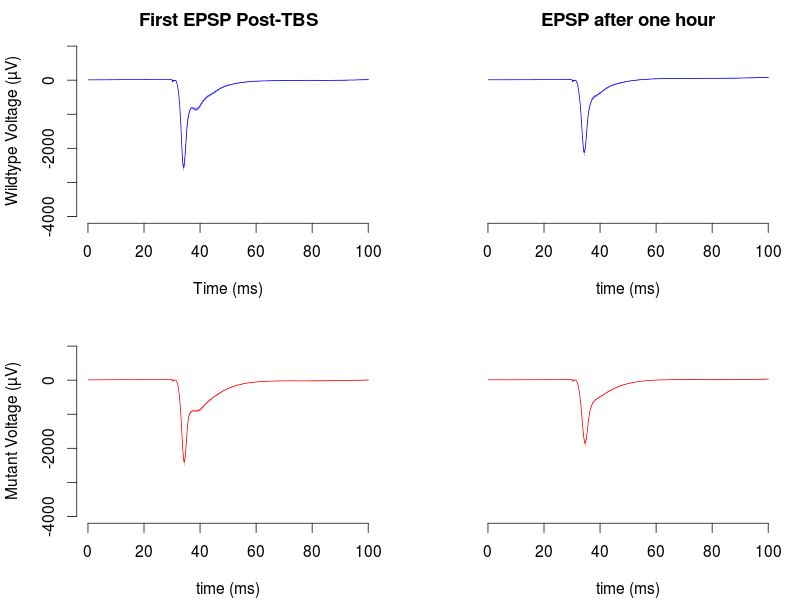
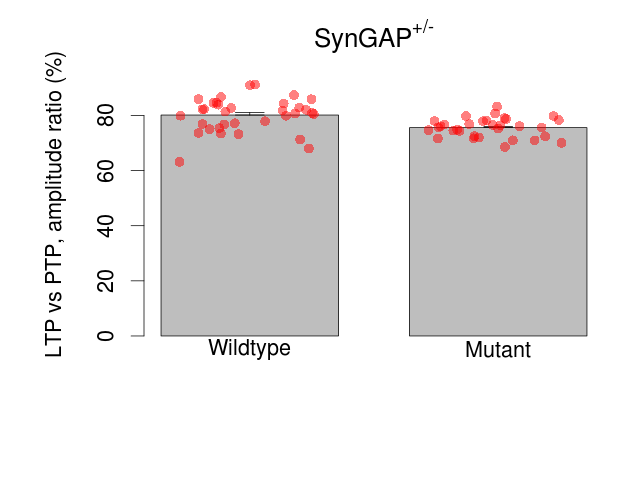
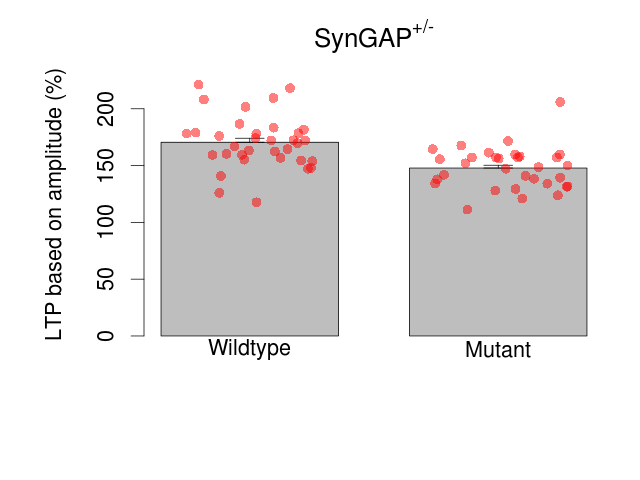
Variables shown are: LTP vs PTP, amplitude ratio, Reduction in potentiation from immediately after theta-burst stimulation to one hour later, fEPSP amplitude ratio. LTP based on amplitude, Long term potentiation, ratio of amplitudes of fEPSPs in test pathway and control pathway.
| Variable | Units | Wildtype slices (animals) | Wildtype mean (SEM) | Mutant slices (animals) | Mutant mean (SEM) | P(animals) | P(mutation) |
|---|---|---|---|---|---|---|---|
| LTP vs PTP, amplitude ratio | % | 34 (11) | 80.1 (1.1) | 32 (10) | 75.6 (0.6) | 0.34 | 0.0022 ** |
| LTP based on amplitude | % | 34 (11) | 170.5 (4) | 32 (10) | 147.8 (3.2) | 0.96 | 1.1e-05 *** |
Behaviour raw data
| Animals | View |
| Elevated Plus Maze | View |
| Open Field | View |
| Novel Object Exploration | View |
| Rotarod | View |
Hippocampal slice electrophysiology raw data
| Animals and Brain slices | View |
| Field EPSP (Maximum) | View |
| Paired Pulse Facilitation | View |
| Long Term Potentiation | View |
| Data Files | View |