G2C::Electrophysiology
nGAP knock-out mouse
S.G.N. Grant and the G2C Consortium
Corresponding email: Seth.Grant@ed.ac.uk
- Overview
- Basal Synaptic Transmission
- Paired Pulse Facilitation
- Theta Burst Stimulation
- Long Term Potentiation
- Raw Data
Overview: Effect sizes (Cohen d) for 18 electrophysiology variables
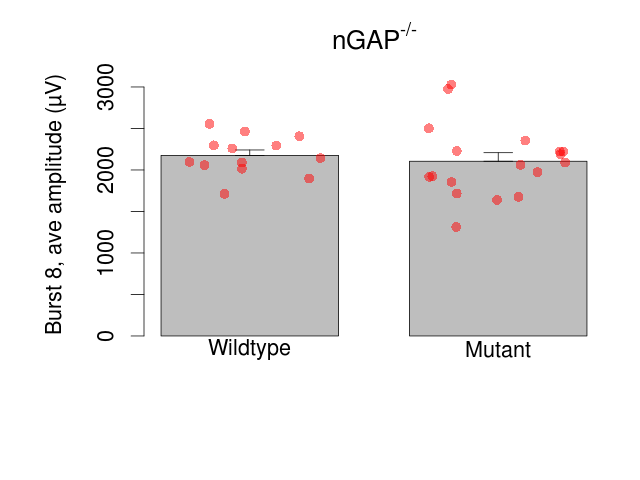
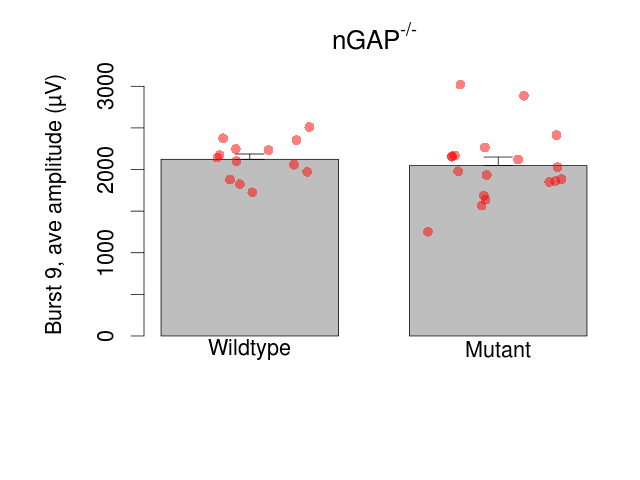
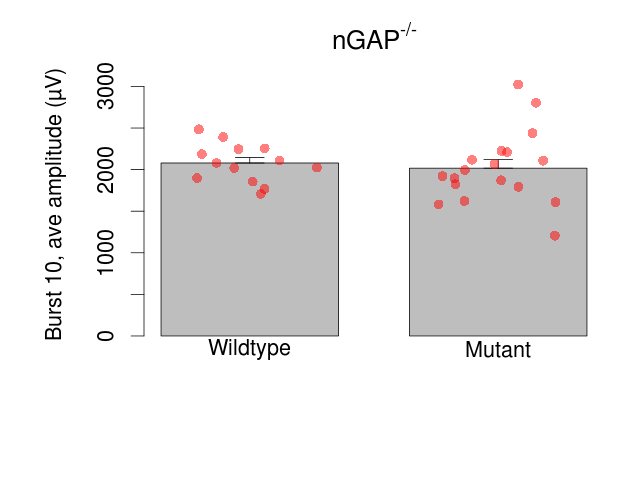
Mutant slices showed little overall electrophysiological difference from wildtype slices, with no electrophysiological variables significantly affected by this mutation. Note that in the theta burst analysis, the tenth burst is analysed as representative of individual burst amplitude.
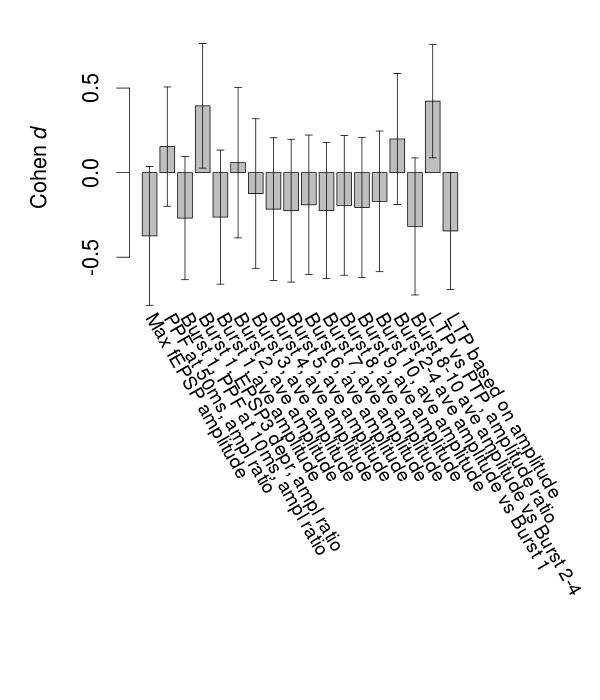
Variables shown are: Max fEPSP amplitude, Maximum field excitatory postsynaptic potential (fEPSP) amplitude. PPF at 50ms, ampl ratio, Paired pulse facilitation (PPF), pulses separated by 50ms, amplitude ratio. Burst 1, PPF at 10ms, ampl ratio, Paired pulse facilitation (PPF), pulses separated by 10ms, amplitude ratio, observed during first two pulses of the first 100Hz burst during theta-burst stimulation. Burst 1, EPSP3 depr, ampl ratio, Depression observed in third fEPSP relative to the second fEPSP of the first 100Hz burst, amplitude ratio. Burst 1, ave amplitude, Average amplitude of four fEPSPs in first burst. Burst 2, ave amplitude, Average amplitude of four fEPSPs in second burst. Burst 3, ave amplitude, Average amplitude of four fEPSPs in third burst. Burst 4, ave amplitude, Average amplitude of four fEPSPs in fourth burst. Burst 5, ave amplitude, Average amplitude of four fEPSPs in fifth burst. Burst 6, ave amplitude, Average amplitude of four fEPSPs in sixth burst. Burst 7, ave amplitude, Average amplitude of four fEPSPs in seventh burst. Burst 8, ave amplitude, Average amplitude of four fEPSPs in eighth burst. Burst 9, ave amplitude, Average amplitude of four fEPSPs in ninth burst. Burst 10, ave amplitude, Average amplitude of four fEPSPs in tenth burst. Burst 2-4 ave amplitude vs Burst 1, Facilitation observed in average amplitude of bursts 2-4, relative to average amplitude of burst 1. Burst 8-10 ave amplitude vs Burst 2-4, Depression observed in average amplitude of bursts 8-10, relative to average amplitude of bursts 2-4. LTP vs PTP, amplitude ratio, Reduction in potentiation from immediately after theta-burst stimulation to one hour later, fEPSP amplitude ratio. LTP based on amplitude, Long term potentiation, ratio of amplitudes of fEPSPs in test pathway and control pathway.
| Variable | Units | Wildtype slices (animals) | Wildtype mean (SEM) | Mutant slices (animals) | Mutant mean (SEM) | P(animals) | P(mutation) |
|---|---|---|---|---|---|---|---|
| Max fEPSP amplitude | µV | 13 (5) | 3200 (140) | 18 (6) | 3000 (130) | 0.6 | 0.3 |
| PPF at 50ms, ampl ratio | % | 13 (5) | 175.6 (4.9) | 18 (6) | 178.5 (4.7) | 0.58 | 0.66 |
| Burst 1, PPF at 10ms, ampl ratio | % | 13 (5) | 194.9 (6.8) | 18 (6) | 187.3 (7.3) | 0.64 | 0.44 |
| Burst 1, EPSP3 depr, ampl ratio | % | 13 (5) | 66.7 (3.4) | 18 (6) | 71.3 (2.7) | 0.011 * | 0.47 |
| Burst 1, ave amplitude | µV | 13 (5) | 1353 (55) | 18 (6) | 1297 (53) | 0.75 | 0.41 |
| Burst 2, ave amplitude | µV | 13 (5) | 2040 (68) | 18 (6) | 2060 (88) | 0.24 | 0.89 |
| Burst 3, ave amplitude | µV | 13 (5) | 2335 (80) | 18 (6) | 2287 (103) | 0.23 | 0.78 |
| Burst 4, ave amplitude | µV | 13 (5) | 2426 (71) | 18 (6) | 2341 (110) | 0.27 | 0.61 |
| Burst 5, ave amplitude | µV | 13 (5) | 2394 (74) | 18 (6) | 2308 (106) | 0.32 | 0.59 |
| Burst 6, ave amplitude | µV | 13 (5) | 2319 (75) | 18 (6) | 2246 (104) | 0.39 | 0.63 |
| Burst 7, ave amplitude | µV | 13 (5) | 2250 (71) | 18 (6) | 2167 (104) | 0.38 | 0.58 |
| Burst 8, ave amplitude | µV | 13 (5) | 2176 (65) | 18 (6) | 2105 (102) | 0.42 | 0.62 |
| Burst 9, ave amplitude | µV | 13 (5) | 2123 (64) | 18 (6) | 2048 (102) | 0.4 | 0.6 |
| Burst 10, ave amplitude | µV | 13 (5) | 2079 (65) | 18 (6) | 2017 (102) | 0.4 | 0.67 |
| Burst 2-4 ave amplitude vs Burst 1 | % | 13 (5) | 167.4 (4.8) | 18 (6) | 172 (6.2) | 0.27 | 0.64 |
| Burst 8-10 ave amplitude vs Burst 2-4 | % | 13 (5) | 94.1 (1.8) | 18 (6) | 92.3 (1.2) | 0.0062 ** | 0.57 |
| LTP vs PTP, amplitude ratio | % | 13 (5) | 80.3 (1.6) | 18 (6) | 98.6 (13.3) | 0.94 | 0.12 |
| LTP based on amplitude | % | 13 (5) | 171.2 (4.3) | 18 (6) | 162.5 (7.2) | 0.78 | 0.28 |
Basal Synaptic Transmission
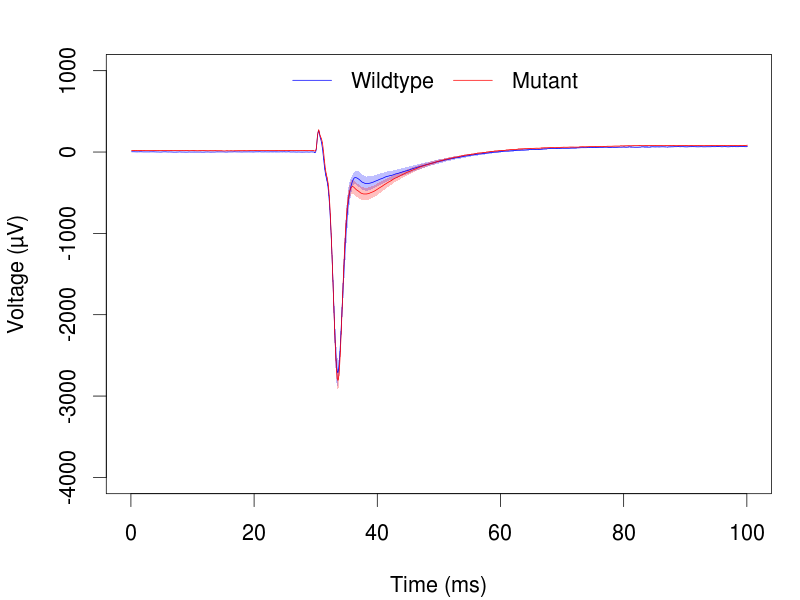
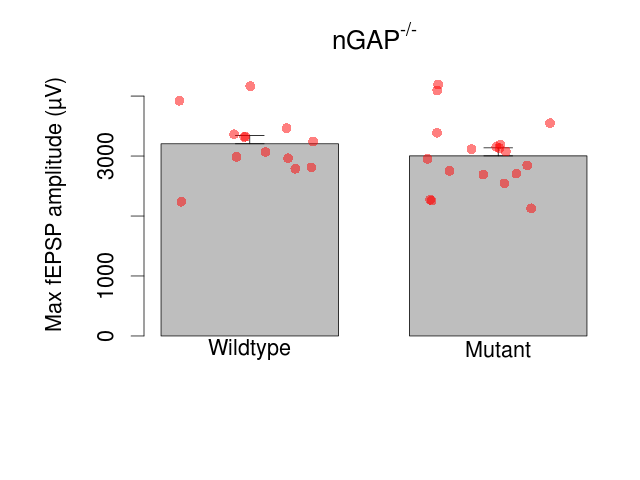
Variables shown are: Max fEPSP amplitude, Maximum field excitatory postsynaptic potential (fEPSP) amplitude.
| Variable | Units | Wildtype slices (animals) | Wildtype mean (SEM) | Mutant slices (animals) | Mutant mean (SEM) | P(animals) | P(mutation) |
|---|---|---|---|---|---|---|---|
| Max fEPSP amplitude | µV | 13 (5) | 3200 (140) | 18 (6) | 3000 (130) | 0.6 | 0.3 |
Paired Pulse Facilitation
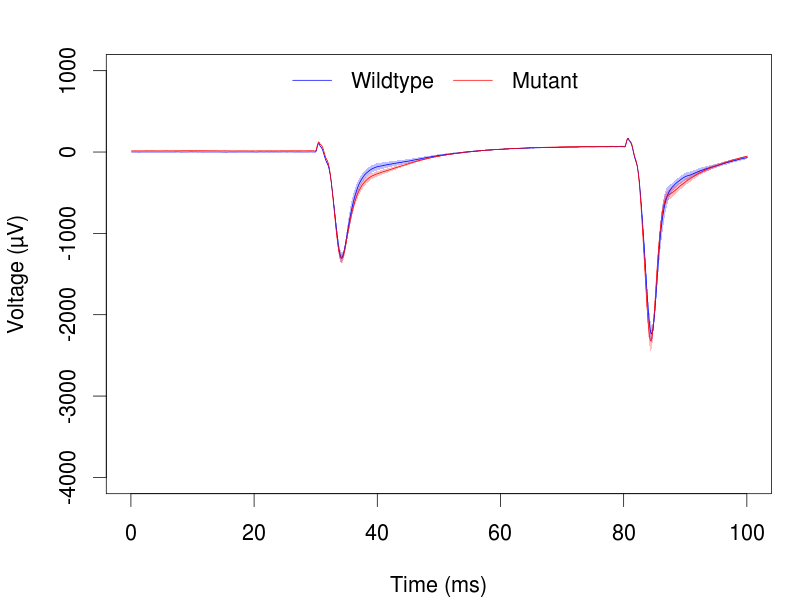
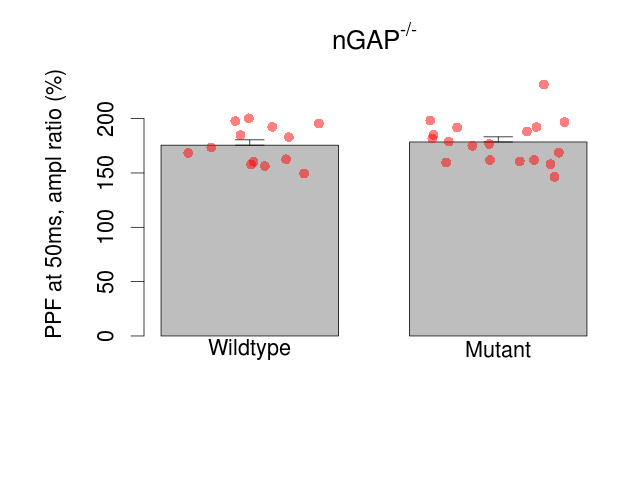
Variables shown are: PPF at 50ms, ampl ratio, Paired pulse facilitation (PPF), pulses separated by 50ms, amplitude ratio.
| Variable | Units | Wildtype slices (animals) | Wildtype mean (SEM) | Mutant slices (animals) | Mutant mean (SEM) | P(animals) | P(mutation) |
|---|---|---|---|---|---|---|---|
| PPF at 50ms, ampl ratio | % | 13 (5) | 175.6 (4.9) | 18 (6) | 178.5 (4.7) | 0.58 | 0.66 |
Theta Burst Stimulation
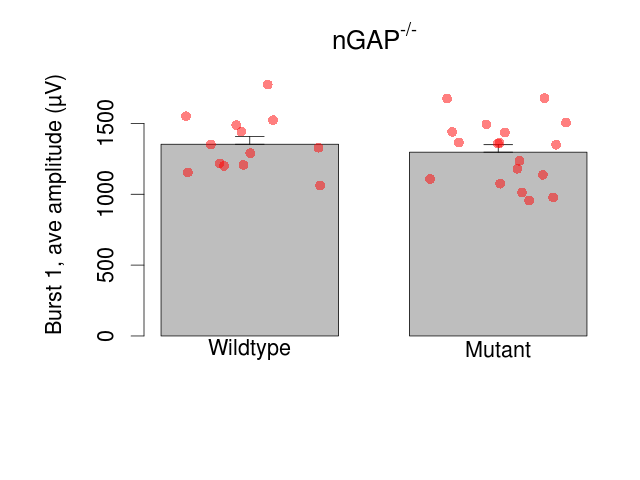
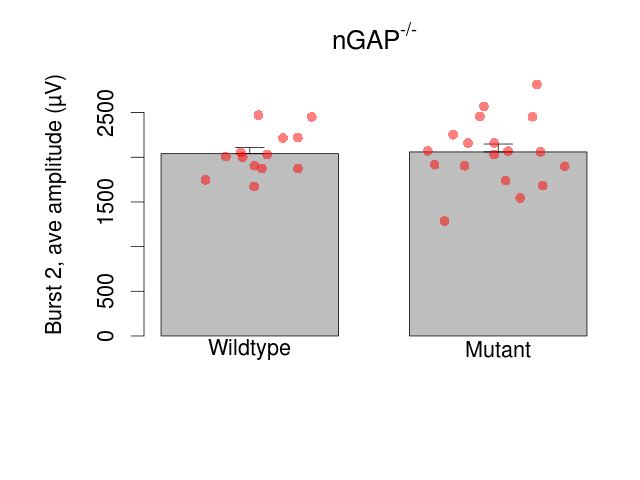
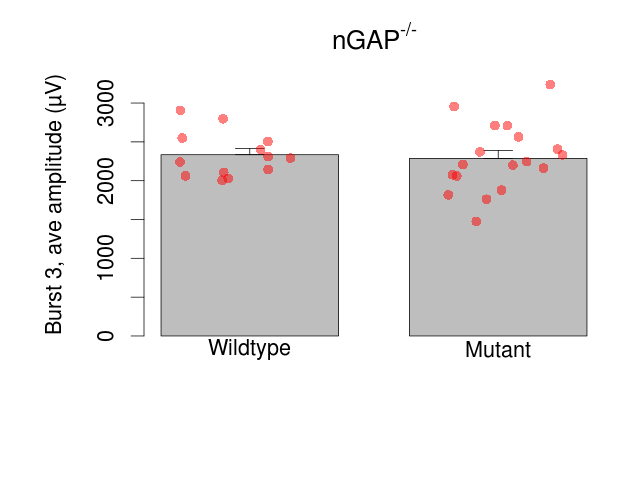
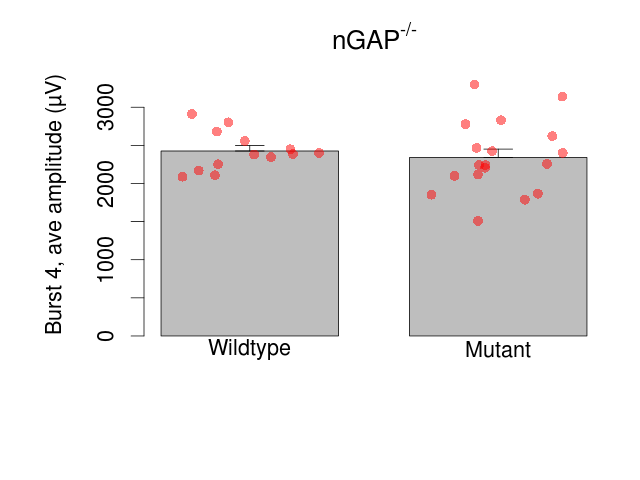
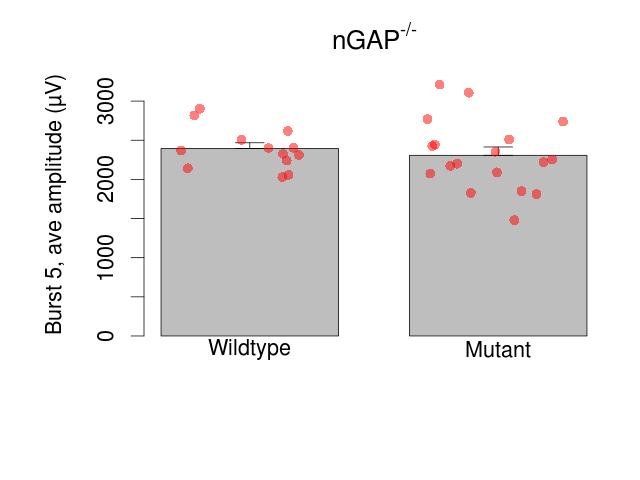
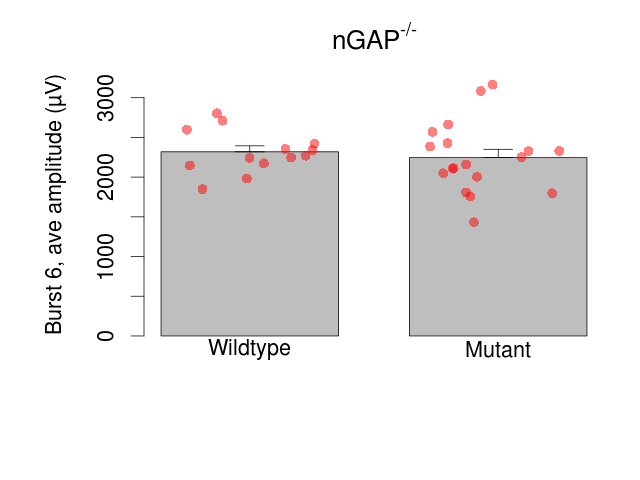
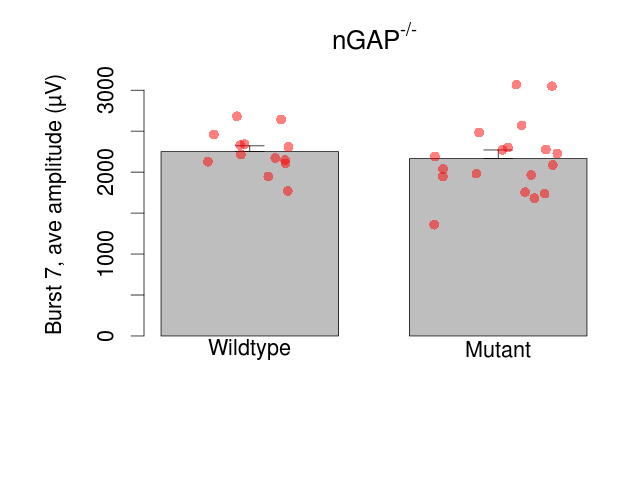
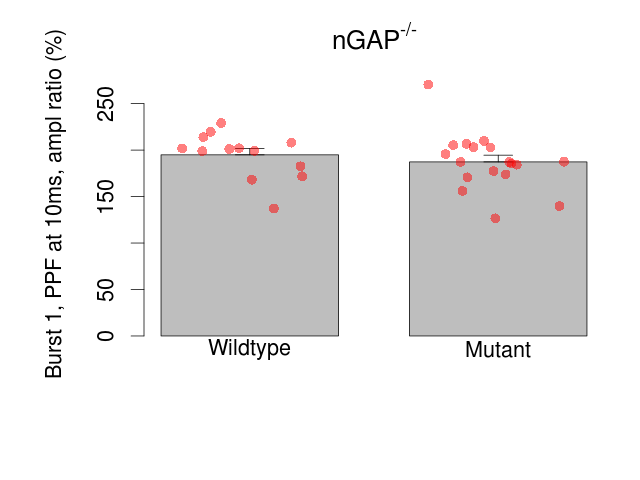
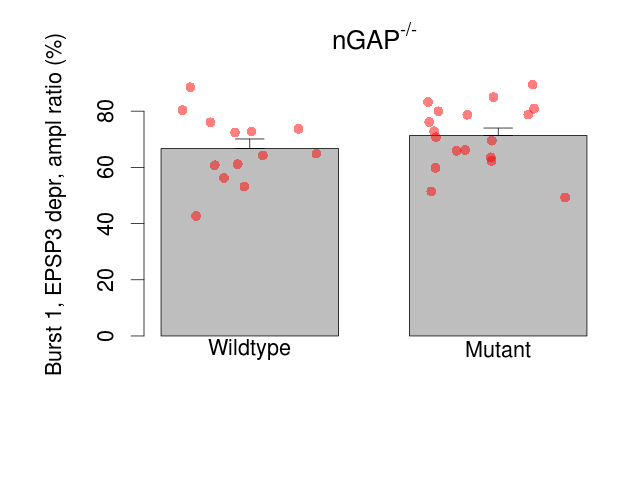
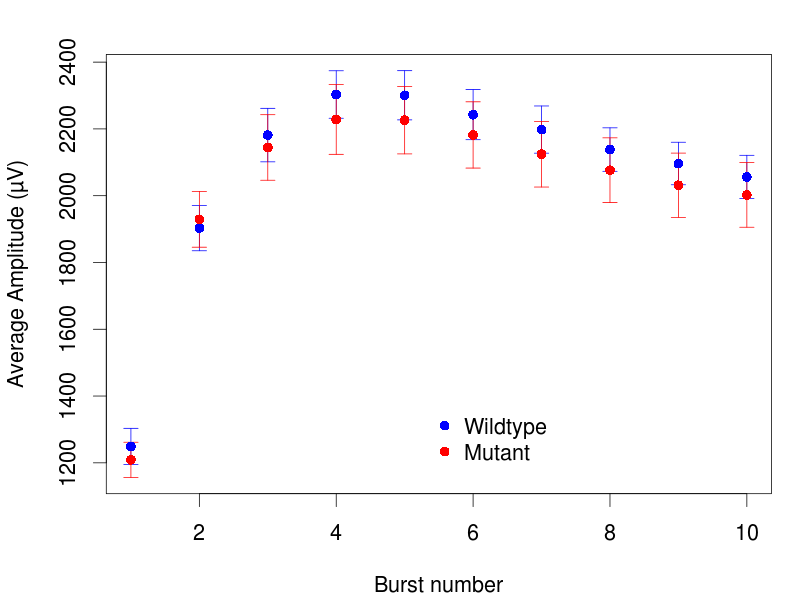
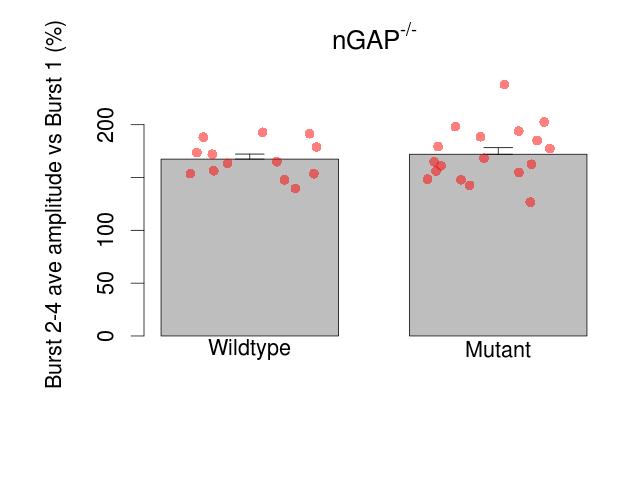
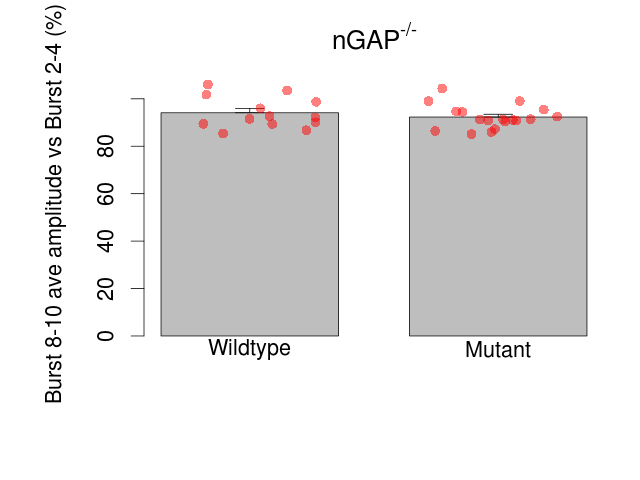
Variables shown are: Burst 1, PPF at 10ms, ampl ratio, Paired pulse facilitation (PPF), pulses separated by 10ms, amplitude ratio, observed during first two pulses of the first 100Hz burst during theta-burst stimulation. Burst 1, EPSP3 depr, ampl ratio, Depression observed in third fEPSP relative to the second fEPSP of the first 100Hz burst, amplitude ratio. Burst 1, ave amplitude, Average amplitude of four fEPSPs in first burst. Burst 2, ave amplitude, Average amplitude of four fEPSPs in second burst. Burst 3, ave amplitude, Average amplitude of four fEPSPs in third burst. Burst 4, ave amplitude, Average amplitude of four fEPSPs in fourth burst. Burst 5, ave amplitude, Average amplitude of four fEPSPs in fifth burst. Burst 6, ave amplitude, Average amplitude of four fEPSPs in sixth burst. Burst 7, ave amplitude, Average amplitude of four fEPSPs in seventh burst. Burst 8, ave amplitude, Average amplitude of four fEPSPs in eighth burst. Burst 9, ave amplitude, Average amplitude of four fEPSPs in ninth burst. Burst 10, ave amplitude, Average amplitude of four fEPSPs in tenth burst. Burst 2-4 ave amplitude vs Burst 1, Facilitation observed in average amplitude of bursts 2-4, relative to average amplitude of burst 1. Burst 8-10 ave amplitude vs Burst 2-4, Depression observed in average amplitude of bursts 8-10, relative to average amplitude of bursts 2-4.
| Variable | Units | Wildtype slices (animals) | Wildtype mean (SEM) | Mutant slices (animals) | Mutant mean (SEM) | P(animals) | P(mutation) |
|---|---|---|---|---|---|---|---|
| Burst 1, PPF at 10ms, ampl ratio | % | 13 (5) | 194.9 (6.8) | 18 (6) | 187.3 (7.3) | 0.64 | 0.44 |
| Burst 1, EPSP3 depr, ampl ratio | % | 13 (5) | 66.7 (3.4) | 18 (6) | 71.3 (2.7) | 0.011 * | 0.47 |
| Burst 1, ave amplitude | µV | 13 (5) | 1353 (55) | 18 (6) | 1297 (53) | 0.75 | 0.41 |
| Burst 2, ave amplitude | µV | 13 (5) | 2040 (68) | 18 (6) | 2060 (88) | 0.24 | 0.89 |
| Burst 3, ave amplitude | µV | 13 (5) | 2335 (80) | 18 (6) | 2287 (103) | 0.23 | 0.78 |
| Burst 4, ave amplitude | µV | 13 (5) | 2426 (71) | 18 (6) | 2341 (110) | 0.27 | 0.61 |
| Burst 5, ave amplitude | µV | 13 (5) | 2394 (74) | 18 (6) | 2308 (106) | 0.32 | 0.59 |
| Burst 6, ave amplitude | µV | 13 (5) | 2319 (75) | 18 (6) | 2246 (104) | 0.39 | 0.63 |
| Burst 7, ave amplitude | µV | 13 (5) | 2250 (71) | 18 (6) | 2167 (104) | 0.38 | 0.58 |
| Burst 8, ave amplitude | µV | 13 (5) | 2176 (65) | 18 (6) | 2105 (102) | 0.42 | 0.62 |
| Burst 9, ave amplitude | µV | 13 (5) | 2123 (64) | 18 (6) | 2048 (102) | 0.4 | 0.6 |
| Burst 10, ave amplitude | µV | 13 (5) | 2079 (65) | 18 (6) | 2017 (102) | 0.4 | 0.67 |
| Burst 2-4 ave amplitude vs Burst 1 | % | 13 (5) | 167.4 (4.8) | 18 (6) | 172 (6.2) | 0.27 | 0.64 |
| Burst 8-10 ave amplitude vs Burst 2-4 | % | 13 (5) | 94.1 (1.8) | 18 (6) | 92.3 (1.2) | 0.0062 ** | 0.57 |
Long Term Potentiation
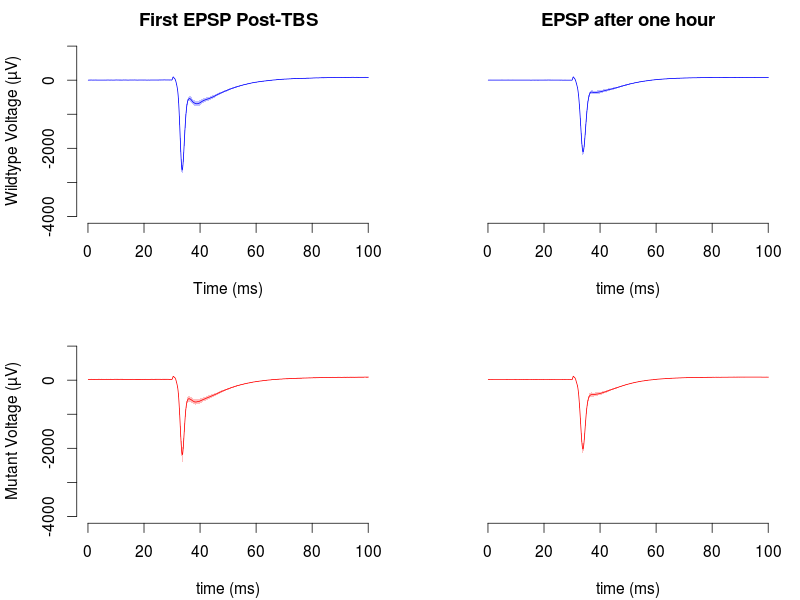
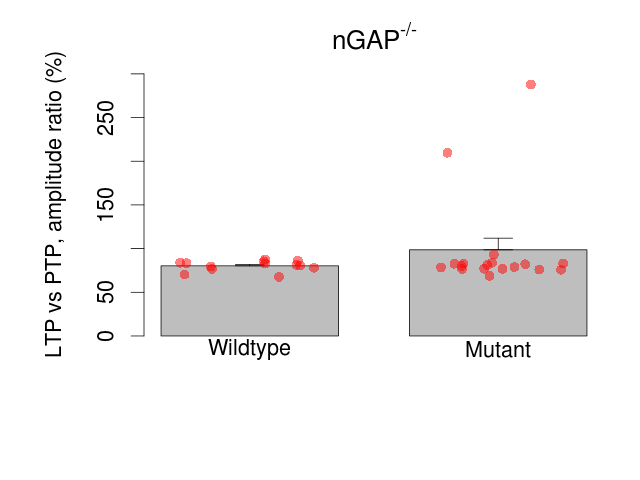
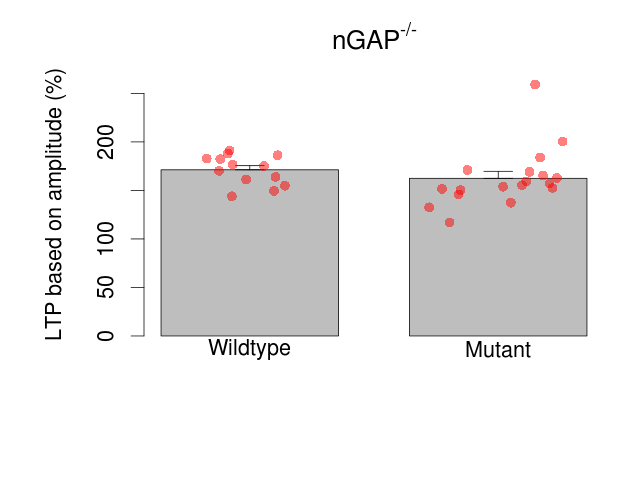
Variables shown are: LTP vs PTP, amplitude ratio, Reduction in potentiation from immediately after theta-burst stimulation to one hour later, fEPSP amplitude ratio. LTP based on amplitude, Long term potentiation, ratio of amplitudes of fEPSPs in test pathway and control pathway.
| Variable | Units | Wildtype slices (animals) | Wildtype mean (SEM) | Mutant slices (animals) | Mutant mean (SEM) | P(animals) | P(mutation) |
|---|---|---|---|---|---|---|---|
| LTP vs PTP, amplitude ratio | % | 13 (5) | 80.3 (1.6) | 18 (6) | 98.6 (13.3) | 0.94 | 0.12 |
| LTP based on amplitude | % | 13 (5) | 171.2 (4.3) | 18 (6) | 162.5 (7.2) | 0.78 | 0.28 |
Hippocampal brain slices summarised by genotype, followed by a list of the animals from which they were prepared.
Hippocampal Slice Electrophysiology Cohort Summary
| Genotype | Count |
|---|---|
| WT | 5 |
| mutant | 6 |
Individual Mice
| Mouse ID | Genotype |
|---|---|
| wA32a5544a2 | WT |
| wAa64210424 | WT |
| wA6bf9df03f | WT |
| wAbe5cdd3fe | WT |
| wA1e1e3961e | WT |
| mB1e1e3961e | mutant |
| mB6bf9df03f | mutant |
| mBa64210424 | mutant |
| mB32a5544a2 | mutant |
| mBbe5cdd3fe | mutant |
| mAf0a50db68 | mutant |
Field EPSP (Maximum)
| Mouse ID | Genotype | Slice Number | Recording Channel | File Name |
|---|---|---|---|---|
| mBbe5cdd3fe | mutant | 5 | 62A | be5cdd3fe_slices_4-5-x-6.zip |
| mBbe5cdd3fe | mutant | 6 | 43B | be5cdd3fe_slices_4-5-x-6.zip |
| mB1e1e3961e | mutant | 5 | 55B | 1e1e3961e_slices_x-4-5-6.zip |
| mB1e1e3961e | mutant | 6 | 52B | 1e1e3961e_slices_x-4-5-6.zip |
| mB32a5544a2 | mutant | 4 | 15A | 32a5544a2_slices_4-5-6-7.zip |
| mB32a5544a2 | mutant | 6 | 12B | 32a5544a2_slices_4-5-6-7.zip |
| mB32a5544a2 | mutant | 7 | 42B | 32a5544a2_slices_4-5-6-7.zip |
| mAf0a50db68 | mutant | 1 | 12A | f0a50db68_slices_1-2-3-x.zip |
| mAf0a50db68 | mutant | 2 | 61A | f0a50db68_slices_1-2-3-x.zip |
| mAf0a50db68 | mutant | 3 | 12B | f0a50db68_slices_1-2-3-x.zip |
| mAf0a50db68 | mutant | 7 | 43B | f0a50db68_slices_4-5-6-7.zip |
| mBa64210424 | mutant | 2 | 38B | a64210424_slices_x-1-2-x.zip |
| mBa64210424 | mutant | 4 | 52A | a64210424_slices_3-4-5-6.zip |
| mBa64210424 | mutant | 5 | 46B | a64210424_slices_3-4-5-6.zip |
| mBa64210424 | mutant | 6 | 42B | a64210424_slices_3-4-5-6.zip |
| mB6bf9df03f | mutant | 4 | 38A | 6bf9df03f_slices_4-5-6-7.zip |
| mB6bf9df03f | mutant | 5 | 62A | 6bf9df03f_slices_4-5-6-7.zip |
| mB6bf9df03f | mutant | 6 | 46B | 6bf9df03f_slices_4-5-6-7.zip |
| mB6bf9df03f | mutant | 7 | 61B | 6bf9df03f_slices_4-5-6-7.zip |
| wAbe5cdd3fe | WT | 1 | 46A | be5cdd3fe_slices_1-2-3-x.zip |
| wAbe5cdd3fe | WT | 2 | 62A | be5cdd3fe_slices_1-2-3-x.zip |
| wAbe5cdd3fe | WT | 3 | 15B | be5cdd3fe_slices_1-2-3-x.zip |
| wA1e1e3961e | WT | 1 | 55A | 1e1e3961e_slices_1-2-3-x.zip |
| wA1e1e3961e | WT | 2 | 61A | 1e1e3961e_slices_1-2-3-x.zip |
| wA1e1e3961e | WT | 3 | 58B | 1e1e3961e_slices_1-2-3-x.zip |
| wA32a5544a2 | WT | 1 | 46A | 32a5544a2_slices_1-2-3-x.zip |
| wA32a5544a2 | WT | 2 | 61A | 32a5544a2_slices_1-2-3-x.zip |
| wAa64210424 | WT | 1 | 41A | a64210424_slices_x-1-2-x.zip |
| wAa64210424 | WT | 3 | 15A | a64210424_slices_3-4-5-6.zip |
| wA6bf9df03f | WT | 1 | 55A | 6bf9df03f_slices_1-2-3-x.zip |
| wA6bf9df03f | WT | 2 | 53A | 6bf9df03f_slices_1-2-3-x.zip |
| wA6bf9df03f | WT | 3 | 55B | 6bf9df03f_slices_1-2-3-x.zip |
Paired Pulse Facilitation
| Mouse ID | Genotype | Slice Number | Recording Channel | File Name |
|---|---|---|---|---|
| mBbe5cdd3fe | mutant | 5 | 62A | be5cdd3fe_slices_4-5-x-6.zip |
| mBbe5cdd3fe | mutant | 6 | 43B | be5cdd3fe_slices_4-5-x-6.zip |
| mB1e1e3961e | mutant | 5 | 55B | 1e1e3961e_slices_x-4-5-6.zip |
| mB1e1e3961e | mutant | 6 | 52B | 1e1e3961e_slices_x-4-5-6.zip |
| mB32a5544a2 | mutant | 4 | 15A | 32a5544a2_slices_4-5-6-7.zip |
| mB32a5544a2 | mutant | 6 | 12B | 32a5544a2_slices_4-5-6-7.zip |
| mB32a5544a2 | mutant | 7 | 42B | 32a5544a2_slices_4-5-6-7.zip |
| mAf0a50db68 | mutant | 1 | 12A | f0a50db68_slices_1-2-3-x.zip |
| mAf0a50db68 | mutant | 2 | 61A | f0a50db68_slices_1-2-3-x.zip |
| mAf0a50db68 | mutant | 3 | 12B | f0a50db68_slices_1-2-3-x.zip |
| mAf0a50db68 | mutant | 7 | 43B | f0a50db68_slices_4-5-6-7.zip |
| mBa64210424 | mutant | 2 | 38B | a64210424_slices_x-1-2-x.zip |
| mBa64210424 | mutant | 4 | 52A | a64210424_slices_3-4-5-6.zip |
| mBa64210424 | mutant | 5 | 46B | a64210424_slices_3-4-5-6.zip |
| mBa64210424 | mutant | 6 | 42B | a64210424_slices_3-4-5-6.zip |
| mB6bf9df03f | mutant | 4 | 38A | 6bf9df03f_slices_4-5-6-7.zip |
| mB6bf9df03f | mutant | 5 | 62A | 6bf9df03f_slices_4-5-6-7.zip |
| mB6bf9df03f | mutant | 6 | 46B | 6bf9df03f_slices_4-5-6-7.zip |
| mB6bf9df03f | mutant | 7 | 61B | 6bf9df03f_slices_4-5-6-7.zip |
| wAbe5cdd3fe | WT | 1 | 46A | be5cdd3fe_slices_1-2-3-x.zip |
| wAbe5cdd3fe | WT | 2 | 62A | be5cdd3fe_slices_1-2-3-x.zip |
| wAbe5cdd3fe | WT | 3 | 15B | be5cdd3fe_slices_1-2-3-x.zip |
| wA1e1e3961e | WT | 1 | 55A | 1e1e3961e_slices_1-2-3-x.zip |
| wA1e1e3961e | WT | 2 | 61A | 1e1e3961e_slices_1-2-3-x.zip |
| wA1e1e3961e | WT | 3 | 58B | 1e1e3961e_slices_1-2-3-x.zip |
| wA32a5544a2 | WT | 1 | 46A | 32a5544a2_slices_1-2-3-x.zip |
| wA32a5544a2 | WT | 2 | 61A | 32a5544a2_slices_1-2-3-x.zip |
| wAa64210424 | WT | 1 | 41A | a64210424_slices_x-1-2-x.zip |
| wAa64210424 | WT | 3 | 15A | a64210424_slices_3-4-5-6.zip |
| wA6bf9df03f | WT | 1 | 55A | 6bf9df03f_slices_1-2-3-x.zip |
| wA6bf9df03f | WT | 2 | 53A | 6bf9df03f_slices_1-2-3-x.zip |
| wA6bf9df03f | WT | 3 | 55B | 6bf9df03f_slices_1-2-3-x.zip |
Long Term Potentiation
| Mouse ID | Genotype | Slice Number | Recording Channel | File Name |
|---|---|---|---|---|
| mBbe5cdd3fe | mutant | 5 | 62A | be5cdd3fe_slices_4-5-x-6.zip |
| mBbe5cdd3fe | mutant | 6 | 43B | be5cdd3fe_slices_4-5-x-6.zip |
| mB1e1e3961e | mutant | 5 | 55B | 1e1e3961e_slices_x-4-5-6.zip |
| mB1e1e3961e | mutant | 6 | 52B | 1e1e3961e_slices_x-4-5-6.zip |
| mB32a5544a2 | mutant | 4 | 15A | 32a5544a2_slices_4-5-6-7.zip |
| mB32a5544a2 | mutant | 6 | 12B | 32a5544a2_slices_4-5-6-7.zip |
| mB32a5544a2 | mutant | 7 | 42B | 32a5544a2_slices_4-5-6-7.zip |
| mAf0a50db68 | mutant | 1 | 12A | f0a50db68_slices_1-2-3-x.zip |
| mAf0a50db68 | mutant | 2 | 61A | f0a50db68_slices_1-2-3-x.zip |
| mAf0a50db68 | mutant | 3 | 12B | f0a50db68_slices_1-2-3-x.zip |
| mAf0a50db68 | mutant | 7 | 43B | f0a50db68_slices_4-5-6-7.zip |
| mBa64210424 | mutant | 2 | 38B | a64210424_slices_x-1-2-x.zip |
| mBa64210424 | mutant | 4 | 52A | a64210424_slices_3-4-5-6.zip |
| mBa64210424 | mutant | 5 | 46B | a64210424_slices_3-4-5-6.zip |
| mBa64210424 | mutant | 6 | 42B | a64210424_slices_3-4-5-6.zip |
| mB6bf9df03f | mutant | 4 | 38A | 6bf9df03f_slices_4-5-6-7.zip |
| mB6bf9df03f | mutant | 5 | 62A | 6bf9df03f_slices_4-5-6-7.zip |
| mB6bf9df03f | mutant | 6 | 46B | 6bf9df03f_slices_4-5-6-7.zip |
| mB6bf9df03f | mutant | 7 | 61B | 6bf9df03f_slices_4-5-6-7.zip |
| wAbe5cdd3fe | WT | 1 | 46A | be5cdd3fe_slices_1-2-3-x.zip |
| wAbe5cdd3fe | WT | 2 | 62A | be5cdd3fe_slices_1-2-3-x.zip |
| wAbe5cdd3fe | WT | 3 | 15B | be5cdd3fe_slices_1-2-3-x.zip |
| wA1e1e3961e | WT | 1 | 55A | 1e1e3961e_slices_1-2-3-x.zip |
| wA1e1e3961e | WT | 2 | 61A | 1e1e3961e_slices_1-2-3-x.zip |
| wA1e1e3961e | WT | 3 | 58B | 1e1e3961e_slices_1-2-3-x.zip |
| wA32a5544a2 | WT | 1 | 46A | 32a5544a2_slices_1-2-3-x.zip |
| wA32a5544a2 | WT | 2 | 61A | 32a5544a2_slices_1-2-3-x.zip |
| wAa64210424 | WT | 1 | 41A | a64210424_slices_x-1-2-x.zip |
| wAa64210424 | WT | 3 | 15A | a64210424_slices_3-4-5-6.zip |
| wA6bf9df03f | WT | 1 | 55A | 6bf9df03f_slices_1-2-3-x.zip |
| wA6bf9df03f | WT | 2 | 53A | 6bf9df03f_slices_1-2-3-x.zip |
| wA6bf9df03f | WT | 3 | 55B | 6bf9df03f_slices_1-2-3-x.zip |
Data Files
| File Name | Size | Checksum (SHA256) |
|---|---|---|
| f0a50db68_slices_1-2-3-x.zip | 35736873 | 0025de3e3b187c897f736cc661a6412c41422f2cd9ab83d6f68ad5b10374d1eb |
| 1e1e3961e_slices_x-4-5-6.zip | 49536552 | e140015753384d21d13c81f24729f088c0bf38a5c4db6791048712d041810467 |
| 6bf9df03f_slices_4-5-6-7.zip | 48011588 | 9bde152fdbec42e1d023578e72ad3f64fbfde93d84013a6b14011c82fd607c85 |
| 6bf9df03f_slices_1-2-3-x.zip | 38921538 | 9141aa93a1c8b7d139d8ebb5115385563c9f1f160d78719182603e9577a8bc36 |
| a64210424_slices_x-1-2-x.zip | 34117488 | 7a940a2450e1a28aa5fadc091fa8fff1afca523ed8ff845a311bbf4a60dd5d80 |
| 1e1e3961e_slices_1-2-3-x.zip | 39100411 | 346dd59d84b13343dea2bb04be02d277b46d044c1d925f4089fd546350dccbf1 |
| a64210424_slices_3-4-5-6.zip | 44926852 | af891e2f98f766ae1446e6ba84e39aabade0afee672e197514a514d8b8cb6806 |
| be5cdd3fe_slices_1-2-3-x.zip | 41043457 | bc760ef46a1c419d8af422cc75ceab50cef6be5fc75941c90d66a339db8b9b78 |
| be5cdd3fe_slices_4-5-x-6.zip | 48086244 | 13468304ccea4f95c9c53f05bf998bf29c27fdd07288e12828a72cfec2394ca3 |
| 32a5544a2_slices_4-5-6-7.zip | 46672052 | be189b34d701f32f9dfa3e37538a88035c7576f93c36171a7ed4333e1cd1489b |
| 32a5544a2_slices_1-2-3-x.zip | 36803651 | 5f380eacc9ad0a019a51a3448c9e321efda38006f0c99e57ef8271a8768c114a |
| f0a50db68_slices_4-5-6-7.zip | 45446661 | d0a6e63ec65cd86a45542f1bb66678843de25ff01f8f18d4e31b5d334821039b |